Vertical radar profiling - CGISS - Boise State University
Vertical radar profiling - CGISS - Boise State University
Vertical radar profiling - CGISS - Boise State University

Create successful ePaper yourself
Turn your PDF publications into a flip-book with our unique Google optimized e-Paper software.
J. Tronicke, M.D. Knoll / Journal of Applied Geophysics 57 (2005) 179–191 189<br />
transmitter gathers recorded at the two largest offsets).<br />
Fortunately, the three near-offset transmitter gathers<br />
provide complementary information at depths of 2–16<br />
m, thus ensuring optimal data quality over all depth<br />
ranges.<br />
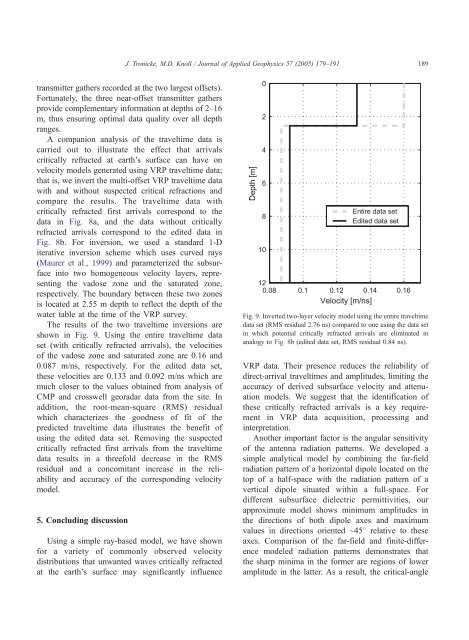
A companion analysis of the traveltime data is<br />
carried out to illustrate the effect that arrivals<br />
critically refracted at earth’s surface can have on<br />
velocity models generated using VRP traveltime data;<br />
that is, we invert the multi-offset VRP traveltime data<br />
with and without suspected critical refractions and<br />
compare the results. The traveltime data with<br />
critically refracted first arrivals correspond to the<br />
data in Fig. 8a, and the data without critically<br />
refracted arrivals correspond to the edited data in<br />
Fig. 8b. For inversion, we used a standard 1-D<br />
iterative inversion scheme which uses curved rays<br />
(Maurer et al., 1999) and parameterized the subsurface<br />
into two homogeneous velocity layers, representing<br />
the vadose zone and the saturated zone,<br />
respectively. The boundary between these two zones<br />
is located at 2.55 m depth to reflect the depth of the<br />
water table at the time of the VRP survey.<br />
The results of the two traveltime inversions are<br />
shown in Fig. 9. Using the entire traveltime data<br />
set (with critically refracted arrivals), the velocities<br />
of the vadose zone and saturated zone are 0.16 and<br />
0.087 m/ns, respectively. For the edited data set,<br />
these velocities are 0.133 and 0.092 m/ns which are<br />
much closer to the values obtained from analysis of<br />
CMP and crosswell geo<strong>radar</strong> data from the site. In<br />
addition, the root-mean-square (RMS) residual<br />
which characterizes the goodness of fit of the<br />
predicted traveltime data illustrates the benefit of<br />
using the edited data set. Removing the suspected<br />
critically refracted first arrivals from the traveltime<br />
data results in a threefold decrease in the RMS<br />
residual and a concomitant increase in the reliability<br />
and accuracy of the corresponding velocity<br />
model.<br />
5. Concluding discussion<br />
Using a simple ray-based model, we have shown<br />
for a variety of commonly observed velocity<br />
distributions that unwanted waves critically refracted<br />
at the earth’s surface may significantly influence<br />
Fig. 9. Inverted two-layer velocity model using the entire traveltime<br />
data set (RMS residual 2.76 ns) compared to one using the data set<br />
in which potential critically refracted arrivals are eliminated in<br />
analogy to Fig. 8b (edited data set, RMS residual 0.84 ns).<br />
VRP data. Their presence reduces the reliability of<br />
direct-arrival traveltimes and amplitudes, limiting the<br />
accuracy of derived subsurface velocity and attenuation<br />
models. We suggest that the identification of<br />
these critically refracted arrivals is a key requirement<br />
in VRP data acquisition, processing and<br />
interpretation.<br />
Another important factor is the angular sensitivity<br />
of the antenna radiation patterns. We developed a<br />
simple analytical model by combining the far-field<br />
radiation pattern of a horizontal dipole located on the<br />
top of a half-space with the radiation pattern of a<br />
vertical dipole situated within a full-space. For<br />
different subsurface dielectric permittivities, our<br />
approximate model shows minimum amplitudes in<br />
the directions of both dipole axes and maximum<br />
values in directions oriented ~458 relative to these<br />
axes. Comparison of the far-field and finite-difference<br />
modeled radiation patterns demonstrates that<br />
the sharp minima in the former are regions of lower<br />
amplitude in the latter. As a result, the critical-angle