Vertical radar profiling - CGISS - Boise State University
Vertical radar profiling - CGISS - Boise State University
Vertical radar profiling - CGISS - Boise State University

You also want an ePaper? Increase the reach of your titles
YUMPU automatically turns print PDFs into web optimized ePapers that Google loves.
J. Tronicke, M.D. Knoll / Journal of Applied Geophysics 57 (2005) 179–191 185<br />
in angular sensitivity between the horizontal and<br />
vertical dipoles are clearly visible.<br />
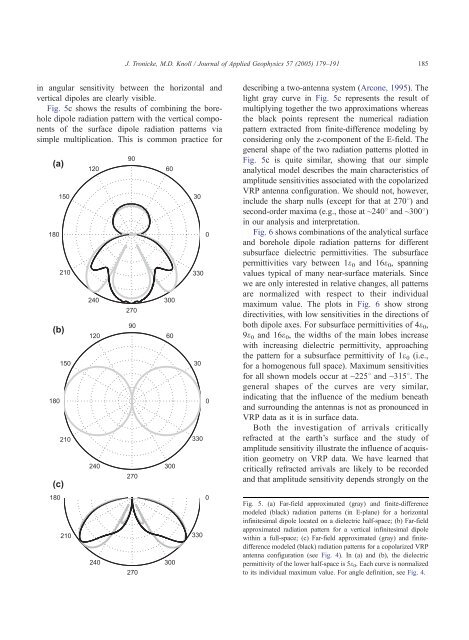
Fig. 5c shows the results of combining the borehole<br />
dipole radiation pattern with the vertical components<br />
of the surface dipole radiation patterns via<br />
simple multiplication. This is common practice for<br />
describing a two-antenna system (Arcone, 1995). The<br />
light gray curve in Fig. 5c represents the result of<br />
multiplying together the two approximations whereas<br />
the black points represent the numerical radiation<br />
pattern extracted from finite-difference modeling by<br />
considering only the z-component of the E-field. The<br />
general shape of the two radiation patterns plotted in<br />
Fig. 5c is quite similar, showing that our simple<br />
analytical model describes the main characteristics of<br />
amplitude sensitivities associated with the copolarized<br />
VRP antenna configuration. We should not, however,<br />
include the sharp nulls (except for that at 2708) and<br />
second-order maxima (e.g., those at ~2408 and ~3008)<br />
in our analysis and interpretation.<br />
Fig. 6 shows combinations of the analytical surface<br />
and borehole dipole radiation patterns for different<br />
subsurface dielectric permittivities. The subsurface<br />
permittivities vary between 1e 0 and 16e 0 , spanning<br />
values typical of many near-surface materials. Since<br />
we are only interested in relative changes, all patterns<br />
are normalized with respect to their individual<br />
maximum value. The plots in Fig. 6 show strong<br />
directivities, with low sensitivities in the directions of<br />
both dipole axes. For subsurface permittivities of 4e 0 ,<br />
9e 0 and 16e 0 , the widths of the main lobes increase<br />
with increasing dielectric permittivity, approaching<br />
the pattern for a subsurface permittivity of 1e 0 (i.e.,<br />
for a homogenous full space). Maximum sensitivities<br />
for all shown models occur at ~2258 and ~3158. The<br />
general shapes of the curves are very similar,<br />
indicating that the influence of the medium beneath<br />
and surrounding the antennas is not as pronounced in<br />
VRP data as it is in surface data.<br />
Both the investigation of arrivals critically<br />
refracted at the earth’s surface and the study of<br />
amplitude sensitivity illustrate the influence of acquisition<br />
geometry on VRP data. We have learned that<br />
critically refracted arrivals are likely to be recorded<br />
and that amplitude sensitivity depends strongly on the<br />
Fig. 5. (a) Far-field approximated (gray) and finite-difference<br />
modeled (black) radiation patterns (in E-plane) for a horizontal<br />
infinitesimal dipole located on a dielectric half-space; (b) Far-field<br />
approximated radiation pattern for a vertical infinitesimal dipole<br />
within a full-space; (c) Far-field approximated (gray) and finitedifference<br />
modeled (black) radiation patterns for a copolarized VRP<br />
antenna configuration (see Fig. 4). In (a) and (b), the dielectric<br />
permittivity of the lower half-space is 5e 0 . Each curve is normalized<br />
to its individual maximum value. For angle definition, see Fig. 4.