Journal of Tehran University Heart Center
Journal of Tehran University Heart Center
Journal of Tehran University Heart Center

You also want an ePaper? Increase the reach of your titles
YUMPU automatically turns print PDFs into web optimized ePapers that Google loves.
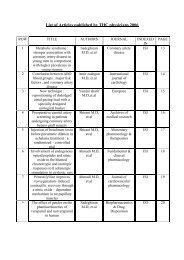
Signal-Averaged Electrocardiography in Patients with Advanced <strong>Heart</strong> Failure: ...<br />
TEHRAN HEART CENTER<br />
Introduction<br />
The high resolution electrocardiography (ECG) is<br />
designed for the body surface recording <strong>of</strong> the cardiac signals<br />
that are not visible on the standard ECG. Signal averaging is<br />
an approach to produce a high resolution electrocardiogram.<br />
In this type <strong>of</strong> electrocardiography, late potentials are<br />
generated by tissues activated later than their usual timing in<br />
the cardiac cycle. 1 We, therefore, designed an observational<br />
study aimed at evaluating the possible correlation between<br />
the data obtained by the signal-averaged electrocardiography<br />
(SAECG) and left ventricular (LV) dimensions and volumes<br />
and compare it with the standard ECG.<br />
Methods<br />
The patients included in the study were selected<br />
consecutively among those referred with a diagnosis <strong>of</strong><br />
heart failure. The inclusion criteria were advanced systolic<br />
LV dysfunction (LV ejection fraction [LVEF] ≤ 35%) and<br />
underlying cause (idiopathic dilated cardiomyopathy or<br />
ischemic heart disease). All the patients signed written<br />
informed consent. We excluded patients with non-sinus<br />
rhythm, previous pacemaker implantation, a recent myocardial<br />
infarction (< 3 months), and severe aortic disease. All the<br />
patients underwent standard twelve-lead ECG, SAECG, and<br />
two-dimensional echocardiography.<br />
Imaging was done in the left lateral decubitus position,<br />
recording the parasternal and apical views (standard longaxis<br />
and two- and four-chamber images) with the aid <strong>of</strong> a<br />
commercially available system (Vingmed 7, General Electric,<br />
Milwaukee, WI, USA). A 3.5-MHz transducer was used.<br />
The LV volumes (end-systolic and end-diastolic) and LVEF<br />
were calculated from the conventional apical two- and fourchamber<br />
images utilizing the biplane Simpson technique.<br />
The QRS duration was measured on the surface ECG. The<br />
ECG was recorded at a speed <strong>of</strong> 25 mm/sec and a scale <strong>of</strong><br />
10 mm/mV. The QRS duration was measured as the widest<br />
QRS complex in the precordial leads. QRS durations ≥ 0.12<br />
sec; no q-wave but slurred, broad R waves in leads I, aVL,<br />
and V 6<br />
; and rS or QS deflections in lead V 1<br />
were considered<br />
as the ECG features <strong>of</strong> left bundle branch block (LBBB). On<br />
the other hand, QRS durations ≥ 120 ms, broad and notched<br />
R waves in leads V 1<br />
and V 2<br />
, and deep S deflections in the<br />
left precordial leads and I were noted as the ECG features<br />
<strong>of</strong> right bundle branch block (RBBB). A prolonged QRS<br />
not associated with the typical features <strong>of</strong> bundle branch<br />
block was labeled as nonspecific intraventricular conduction<br />
delay.<br />
Filtered QRS durations (fQRS) were calculated using the<br />
SAECG (Hellige EK 56, Marquette, Freiburg, Germany)<br />
with noise level < 0.3 µV and high-pass filtering <strong>of</strong> 35 Hz.<br />
The key hardware elements <strong>of</strong> the system were an amplifier,<br />
a convertor for the digitalization <strong>of</strong> the signals, a signal<br />
processor, and a printer. In this system, a computer algorithm<br />
was utilized to identify the QRS onset and <strong>of</strong>fset. Filtering<br />
was applied to reduce the residual noise and improve the<br />
identification <strong>of</strong> the low potentials.<br />
The continuous data were expressed as mean ± standard<br />
deviation values. Linear regression analysis was the chosen<br />
method for evaluating the association between the signalaveraged<br />
data and the echocardiographic indices. A p value<br />
< 0.05 was considered statistically significant.<br />
Results<br />
The study population consisted <strong>of</strong> 86 patients: 67 (77.9%)<br />
men and 19 (22.1%) women with a mean age <strong>of</strong> 54.66 ± 13.23<br />
years (range: 18-79). The underlying etiology <strong>of</strong> heart failure<br />
was ischemic in 60% <strong>of</strong> the patients. Seventy-two (83.8%)<br />
patients were in New York <strong>Heart</strong> Association (NYHA) class<br />
III. The baseline characteristics <strong>of</strong> the study population are<br />
summarized in Table 1.<br />
Table 1. Baseline characteristics <strong>of</strong> study population *<br />
Variable n=86<br />
Age (y) 54.66±13.23<br />
Male/Female 67 (77.9) / 19 (22.1)<br />
Etiology <strong>of</strong> heart failure<br />
Ischemic 52 (60)<br />
Idiopathic 34 (40)<br />
NYHA class<br />
NYHA class II 12 (14)<br />
NYHA class III 72 (83.8)<br />
NYHA class IV 2 (2.3)<br />
QRS morphology<br />
Left bundle branch block 45 (52)<br />
Right bundle branch block 6 (7)<br />
Nonspecific intraventricular conduction delay 35 (41)<br />
*<br />
Data are presented as mean±SD or n (%)<br />
All the patients had sinus rhythm on the ECG. The mean<br />
QRS duration was 0.14 ± 0.03 sec (range: 0.08-0.2 sec), and<br />
45 (52%) patients had LBBB morphology. The mean fQRS<br />
duration was 145.87 ± 24.89 ms (range: 86-200 ms).<br />
The mean LVEF was 18.31 ± 5.49% (range: 10-33%),<br />
and 15.3% <strong>of</strong> the patients had severe mitral regurgitation.<br />
Detailed echocardiographic characteristics <strong>of</strong> the patients are<br />
presented in Table 2.<br />
The multiple linear regression (stepwise method)<br />
demonstrated that while there was a significant correlation<br />
between the fQRS duration and LV end-systolic volume<br />
(r = 0.37, p value = 0.000) (Figure 1-A), LV end-systolic<br />
diameter (r = 0.24, p value = 0.031) (Figure 1-B), LV end-<br />
The <strong>Journal</strong> <strong>of</strong> <strong>Tehran</strong> <strong>University</strong> <strong>Heart</strong> <strong>Center</strong>69