Journal of Tehran University Heart Center
Journal of Tehran University Heart Center
Journal of Tehran University Heart Center

Create successful ePaper yourself
Turn your PDF publications into a flip-book with our unique Google optimized e-Paper software.
The <strong>Journal</strong> <strong>of</strong> <strong>Tehran</strong> <strong>University</strong> <strong>Heart</strong> <strong>Center</strong><br />
Effat Soleimani et al.<br />
horizontal direction is performed. The optimal polyline is<br />
the one that minimizes the cost function. The maximumgradient<br />
algorithm searches along a path perpendicular to<br />
the boundary and picks up the point <strong>of</strong> maximum intensity<br />
gradient. The reference points are placed in the middle <strong>of</strong><br />
the artery. The points are subsequently connected by lines,<br />
and the scanning <strong>of</strong> the image line by line in the horizontal<br />
direction is performed. The gradient <strong>of</strong> each vertical line<br />
is calculated. The boundaries are searched for the local<br />
maximums <strong>of</strong> the image line’s gradient to the left and to the<br />
right from the predefined middle line. This algorithm has<br />
been previously validated by the manual method. 6 Since the<br />
dynamic programming algorithm has the highest accuracy<br />
and the maximum-gradient algorithm requires no training<br />
to perform measurements, 1, 4, 11 we combined them and<br />
designed new s<strong>of</strong>tware in which the reference points were<br />
selected as the maximum-gradient algorithm and the points<br />
with maximum gradients were picked up. Afterward, the best<br />
candidates were those with the least cost function. The cost<br />
function was defined according to the dynamic programming<br />
algorithm.<br />
The ultrasonic examination <strong>of</strong> the right common carotid<br />
artery <strong>of</strong> 10 healthy men (aged 41 ± 2 years) with no history<br />
<strong>of</strong> cardiovascular disease, hypertension, or diabetes 2 was<br />
performed. All the subjects gave informed written consent<br />
for the examination. Before ultrasonography, the subjects<br />
rested for at least 10 minutes in the supine position until<br />
their heart rate and blood pressure reached a steady state.<br />
The common carotid artery <strong>of</strong> the subjects, 2-3 cm proximal<br />
to the bifurcation, was examined with a Sonoline Antares<br />
(Siemens, Germany) ultrasound system equipped with a<br />
5 - 13 MHz linear transducer. the audio video interleave<br />
(AVI) format <strong>of</strong> the consecutive images <strong>of</strong> the common<br />
carotid artery with a frame rate <strong>of</strong> 30 frames per second<br />
was transferred to a PC for post processing. Each recording<br />
contained two cardiac cycles, and the right common carotid<br />
artery was scanned in the longitudinal direction. The s<strong>of</strong>tware<br />
was designed in MATLAB s<strong>of</strong>tware to extract consecutive<br />
images in the bitmap image file (BMP) format from the AVI<br />
movies. This s<strong>of</strong>tware provided the image dimensions (the<br />
images were 547 × 692 pixel 2 ), image type (B-mode), and<br />
pixel dimensions (0.063 × 0.063 mm 2 ).<br />
Because the far wall has better reflections due to the<br />
interface blood-intima-media layers and the arterial wall on<br />
the far side from the transducer are thus more convenient<br />
for measurements, 1 the measurement <strong>of</strong> the radial movement<br />
based on the block-matching algorithm was performed using<br />
ROI with a size <strong>of</strong> approximately 53 × 42 pixel 2 on the intimamedia<br />
thickness <strong>of</strong> the posterior wall <strong>of</strong> the artery. The second<br />
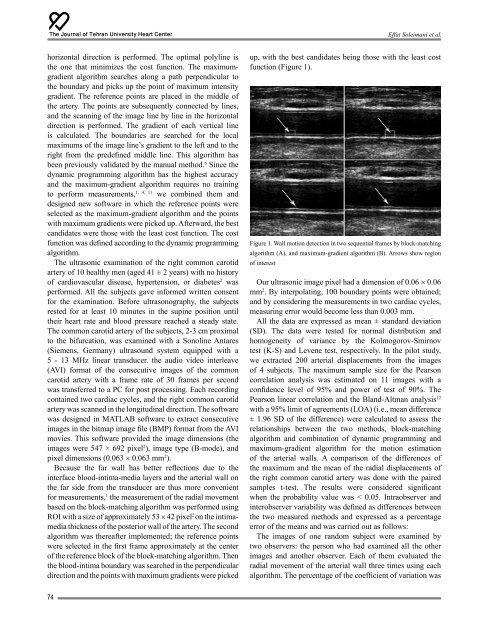
algorithm was thereafter implemented; the reference points<br />
were selected in the first frame approximately at the center<br />
<strong>of</strong> the reference block <strong>of</strong> the block-matching algorithm. Then<br />
the blood-intima boundary was searched in the perpendicular<br />
direction and the points with maximum gradients were picked<br />
up, with the best candidates being those with the least cost<br />
function (Figure 1).<br />
Figure 1. Wall motion detection in two sequential frames by block-matching<br />
algorithm (A), and maximum-gradient algorithm (B). Arrows show region<br />
<strong>of</strong> interest<br />
Our ultrasonic image pixel had a dimension <strong>of</strong> 0.06 × 0.06<br />
mm 2 . By interpolating, 100 boundary points were obtained;<br />
and by considering the measurements in two cardiac cycles,<br />
measuring error would become less than 0.003 mm.<br />
All the data are expressed as mean ± standard deviation<br />
(SD). The data were tested for normal distribution and<br />
homogeneity <strong>of</strong> variance by the Kolmogorov-Smirnov<br />
test (K-S) and Levene test, respectively. In the pilot study,<br />
we extracted 200 arterial displacements from the images<br />
<strong>of</strong> 4 subjects. The maximum sample size for the Pearson<br />
correlation analysis was estimated on 11 images with a<br />
confidence level <strong>of</strong> 95% and power <strong>of</strong> test <strong>of</strong> 90%. The<br />
Pearson linear correlation and the Bland-Altman analysis 12<br />
with a 95% limit <strong>of</strong> agreements (LOA) (i.e., mean difference<br />
± 1.96 SD <strong>of</strong> the difference) were calculated to assess the<br />
relationships between the two methods, block-matching<br />
algorithm and combination <strong>of</strong> dynamic programming and<br />
maximum-gradient algorithm for the motion estimation<br />
<strong>of</strong> the arterial walls. A comparison <strong>of</strong> the differences <strong>of</strong><br />
the maximum and the mean <strong>of</strong> the radial displacements <strong>of</strong><br />
the right common carotid artery was done with the paired<br />
samples t-test. The results were considered significant<br />
when the probability value was < 0.05. Intraobserver and<br />
interobserver variability was defined as differences between<br />
the two measured methods and expressed as a percentage<br />
error <strong>of</strong> the means and was carried out as follows:<br />
The images <strong>of</strong> one random subject were examined by<br />
two observers: the person who had examined all the other<br />
images and another observer. Each <strong>of</strong> them evaluated the<br />
radial movement <strong>of</strong> the arterial wall three times using each<br />
algorithm. The percentage <strong>of</strong> the coefficient <strong>of</strong> variation was<br />
74