SSR Markers Linking to Seed Traits and Total Oil Content in Soybean
SSR Markers Linking to Seed Traits and Total Oil Content in Soybean
SSR Markers Linking to Seed Traits and Total Oil Content in Soybean

You also want an ePaper? Increase the reach of your titles
YUMPU automatically turns print PDFs into web optimized ePapers that Google loves.
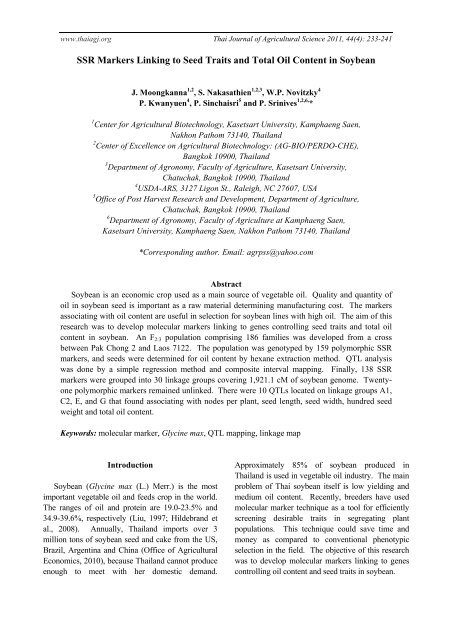
www.thaiagj.org Thai Journal of Agricultural Science 2011, 44(4): 233-241<br />
<strong>SSR</strong> <strong>Markers</strong> <strong>L<strong>in</strong>k<strong>in</strong>g</strong> <strong>to</strong> <strong>Seed</strong> <strong>Traits</strong> <strong>and</strong> <strong>Total</strong> <strong>Oil</strong> <strong>Content</strong> <strong>in</strong> <strong>Soybean</strong><br />
J. Moongkanna 1,2 , S. Nakasathien 1,2,3 , W.P. Novitzky 4<br />
P. Kwanyuen 4 , P. S<strong>in</strong>chaisri 5 <strong>and</strong> P. Sr<strong>in</strong>ives 1,2,6, *<br />
1 Center for Agricultural Biotechnology, Kasetsart University, Kamphaeng Saen,<br />
Nakhon Pathom 73140, Thail<strong>and</strong><br />
2 Center of Excellence on Agricultural Biotechnology: (AG-BIO/PERDO-CHE),<br />
Bangkok 10900, Thail<strong>and</strong><br />
3 Department of Agronomy, Faculty of Agriculture, Kasetsart University,<br />
Chatuchak, Bangkok 10900, Thail<strong>and</strong><br />
4 USDA-ARS, 3127 Ligon St., Raleigh, NC 27607, USA<br />
5 Office of Post Harvest Research <strong>and</strong> Development, Department of Agriculture,<br />
Chatuchak, Bangkok 10900, Thail<strong>and</strong><br />
6 Department of Agronomy, Faculty of Agriculture at Kamphaeng Saen,<br />
Kasetsart University, Kamphaeng Saen, Nakhon Pathom 73140, Thail<strong>and</strong><br />
*Correspond<strong>in</strong>g author. Email: agrpss@yahoo.com<br />
Abstract<br />
<strong>Soybean</strong> is an economic crop used as a ma<strong>in</strong> source of vegetable oil. Quality <strong>and</strong> quantity of<br />
oil <strong>in</strong> soybean seed is important as a raw material determ<strong>in</strong><strong>in</strong>g manufactur<strong>in</strong>g cost. The markers<br />
associat<strong>in</strong>g with oil content are useful <strong>in</strong> selection for soybean l<strong>in</strong>es with high oil. The aim of this<br />
research was <strong>to</strong> develop molecular markers l<strong>in</strong>k<strong>in</strong>g <strong>to</strong> genes controll<strong>in</strong>g seed traits <strong>and</strong> <strong>to</strong>tal oil<br />
content <strong>in</strong> soybean. An F 2:3 population compris<strong>in</strong>g 186 families was developed from a cross<br />
between Pak Chong 2 <strong>and</strong> Laos 7122. The population was genotyped by 159 polymorphic <strong>SSR</strong><br />
markers, <strong>and</strong> seeds were determ<strong>in</strong>ed for oil content by hexane extraction method. QTL analysis<br />
was done by a simple regression method <strong>and</strong> composite <strong>in</strong>terval mapp<strong>in</strong>g. F<strong>in</strong>ally, 138 <strong>SSR</strong><br />
markers were grouped <strong>in</strong><strong>to</strong> 30 l<strong>in</strong>kage groups cover<strong>in</strong>g 1,921.1 cM of soybean genome. Twentyone<br />
polymorphic markers rema<strong>in</strong>ed unl<strong>in</strong>ked. There were 10 QTLs located on l<strong>in</strong>kage groups A1,<br />
C2, E, <strong>and</strong> G that found associat<strong>in</strong>g with nodes per plant, seed length, seed width, hundred seed<br />
weight <strong>and</strong> <strong>to</strong>tal oil content.<br />
Keywords: molecular marker, Glyc<strong>in</strong>e max, QTL mapp<strong>in</strong>g, l<strong>in</strong>kage map<br />
Introduction<br />
<strong>Soybean</strong> (Glyc<strong>in</strong>e max (L.) Merr.) is the most<br />
important vegetable oil <strong>and</strong> feeds crop <strong>in</strong> the world.<br />
The ranges of oil <strong>and</strong> prote<strong>in</strong> are 19.0-23.5% <strong>and</strong><br />
34.9-39.6%, respectively (Liu, 1997; Hildebr<strong>and</strong> et<br />
al., 2008). Annually, Thail<strong>and</strong> imports over 3<br />
million <strong>to</strong>ns of soybean seed <strong>and</strong> cake from the US,<br />
Brazil, Argent<strong>in</strong>a <strong>and</strong> Ch<strong>in</strong>a (Office of Agricultural<br />
Economics, 2010), because Thail<strong>and</strong> cannot produce<br />
enough <strong>to</strong> meet with her domestic dem<strong>and</strong>.<br />
Approximately 85% of soybean produced <strong>in</strong><br />
Thail<strong>and</strong> is used <strong>in</strong> vegetable oil <strong>in</strong>dustry. The ma<strong>in</strong><br />
problem of Thai soybean itself is low yield<strong>in</strong>g <strong>and</strong><br />
medium oil content. Recently, breeders have used<br />
molecular marker technique as a <strong>to</strong>ol for efficiently<br />
screen<strong>in</strong>g desirable traits <strong>in</strong> segregat<strong>in</strong>g plant<br />
populations. This technique could save time <strong>and</strong><br />
money as compared <strong>to</strong> conventional phenotypic<br />
selection <strong>in</strong> the field. The objective of this research<br />
was <strong>to</strong> develop molecular markers l<strong>in</strong>k<strong>in</strong>g <strong>to</strong> genes<br />
controll<strong>in</strong>g oil content <strong>and</strong> seed traits <strong>in</strong> soybean.
234 J. Moongkanna et al. Thai Journal of Agricultural Science<br />
Materials <strong>and</strong> Methods<br />
Plant Materials <strong>and</strong> Phenoty<strong>in</strong>g<br />
An F 2:3 population compris<strong>in</strong>g 186 families was<br />
developed from cross<strong>in</strong>g between Pak Chong 2 <strong>and</strong><br />
Laos 7122 <strong>and</strong> grown <strong>in</strong> the field of Kasetsart<br />
University, Kamphaeng Saen, Nakhon Pathom,<br />
Thail<strong>and</strong>. Data on agronomic traits were collected<br />
from 5 r<strong>and</strong>om plants of each F 3 family. Plant<br />
height (m) was measured from the ground <strong>to</strong> the tip<br />
of the central axis on ma<strong>in</strong> stem when 95% of<br />
plants <strong>in</strong> the plot atta<strong>in</strong>ed maturity. Number of<br />
nodes on ma<strong>in</strong> stem per plant was counted <strong>and</strong><br />
averaged data from the 5 plants were used <strong>in</strong><br />
analysis. <strong>Seed</strong> length <strong>and</strong> seed width were<br />
measured <strong>in</strong> mm from ten seeds each of the 5<br />
plants. One hundred seed weight (g) was measured<br />
from 100 seeds per plant.<br />
<strong>Total</strong> oil content was determ<strong>in</strong>ed from ground<br />
F 4 seed samples us<strong>in</strong>g hexane extraction method<br />
which had been optimized for 0.5 g soybean meal.<br />
A suitable condition for hexane extraction <strong>in</strong><br />
16×100 mm test tube was used <strong>to</strong> screen the<br />
population. Briefly, each sample was extracted by<br />
3 ml hexane volume by shak<strong>in</strong>g for 15 m<strong>in</strong> <strong>and</strong><br />
<strong>in</strong>cubated for 3 h <strong>in</strong> each cycle. The extraction<br />
process was repeated 3 times <strong>and</strong> <strong>in</strong>cubated<br />
overnight <strong>in</strong> the last step. <strong>Total</strong> oil content was<br />
presented <strong>in</strong> percentage of dry meal.<br />
DNA Isolation <strong>and</strong> <strong>SSR</strong> Genotyp<strong>in</strong>g<br />
Two <strong>to</strong> three grams of young trifoliolate leaves<br />
were collected <strong>in</strong> bulk from each parental l<strong>in</strong>e <strong>and</strong><br />
<strong>in</strong>dividual F 2 plants. Genomic DNA was extracted<br />
by modified CTAB method recommended by Lodhi<br />
et al. (1994). DNA concentration was estimated on<br />
0.8% agarose gel electrophoresis for 30 m<strong>in</strong> at 100<br />
V <strong>in</strong> 1x TBE buffer, sta<strong>in</strong>ed with ethidium bromide.<br />
The DNA b<strong>and</strong>s were compared with a known<br />
concentration of st<strong>and</strong>ard λ DNA <strong>and</strong> pho<strong>to</strong>graphed<br />
under UV light us<strong>in</strong>g a gel documentation<br />
(SYNGENE, Genius). The s<strong>to</strong>ck DNA solution was<br />
adjusted <strong>to</strong> the work<strong>in</strong>g concentration of 10 ng µL -1<br />
with TE buffer pH 8.0 <strong>and</strong> s<strong>to</strong>red at -20ºC until use.<br />
<strong>SSR</strong> markers were synthesized follow<strong>in</strong>g the<br />
sequences published on the Soybase website<br />
(http://soybase.org). Four hundred <strong>and</strong> twenty-eight<br />
<strong>SSR</strong> primers were used <strong>to</strong> survey for polymorphism<br />
among the parental l<strong>in</strong>es. The polymorphic markers<br />
were later used <strong>to</strong> genotype the F 2:3 population.<br />
Polymerase cha<strong>in</strong> reaction (PCR) was performed <strong>in</strong><br />
a 10 µL volume conta<strong>in</strong><strong>in</strong>g 1x Taq buffer with<br />
(NH 4 ) 2 SO 4 , 40 ng DNA, 2.5 µM forward <strong>and</strong><br />
reverse primers, 20 mM MgCl 2 , 200 µM each<br />
dNTP, 1 unit Taq DNA polymerase (Fermentas,<br />
Lithuania). PCR reaction was conducted <strong>in</strong> a<br />
thermocycler of MJ Research model PTC-100 TM<br />
(MJ Research, Inc., Water<strong>to</strong>wn, USA.). The<br />
reactions were pre-denatured at 94ºC for 2 m<strong>in</strong> <strong>and</strong><br />
denatured at 94ºC for 30 s. The cycle was repeated<br />
35 times, then annealed for 30 s at 47-55ºC,<br />
depend<strong>in</strong>g on <strong>SSR</strong> primers, elongation at 72ºC for 1<br />
m<strong>in</strong> <strong>and</strong> the f<strong>in</strong>al elongation was held at 72ºC for 10<br />
m<strong>in</strong>. Amplified PCR product was separated by<br />
electrophoresis on denatur<strong>in</strong>g 5% polyacrylamide<br />
gel <strong>in</strong> 0.5x TBE buffer. The polyacrylamide gel was<br />
cast us<strong>in</strong>g the Bio-Rad 38 × 50 cm gel apparatus <strong>and</strong><br />
electrophoresed at a constant power of 70 W for 3-4<br />
h depend<strong>in</strong>g on the PCR product size. The gel was<br />
sta<strong>in</strong>ed with silver sta<strong>in</strong> solution <strong>and</strong> visually scored.<br />
The polymorphic <strong>SSR</strong> data were used <strong>to</strong> construct a<br />
l<strong>in</strong>kage map. The marker data were scored <strong>in</strong> each<br />
<strong>SSR</strong> loci, giv<strong>in</strong>g A for homozygous alleles <strong>in</strong>herited<br />
from the female parent (Pak Chong 2), giv<strong>in</strong>g B for<br />
homozygous alleles <strong>in</strong>herited from the male parent<br />
(Laos 7122), giv<strong>in</strong>g H for heterozygous alleles from<br />
both parents. Only the primers with clear <strong>and</strong><br />
repeatable <strong>in</strong> the parents were used <strong>to</strong> screen the F 2:3<br />
population.<br />
Data Analysis<br />
Segregation of each <strong>SSR</strong> primer <strong>in</strong> the F 2:3<br />
population was tested for goodness of fit aga<strong>in</strong>st a<br />
1:2:1 ratio by a Chi-square. The marker loci that<br />
fitted with the ratio were used <strong>to</strong> construct the<br />
l<strong>in</strong>kage map us<strong>in</strong>g Jo<strong>in</strong>Map 3.0 software (Van<br />
Ooijen <strong>and</strong> Voorrips, 2001). The specified<br />
parameters <strong>in</strong>cluded the map distance <strong>in</strong> Kosambi<br />
function with the l<strong>in</strong>kage criteria, a LOD score of<br />
greater than 3.0 <strong>and</strong> the maximum genetic distance<br />
of 50 cM. The error detection probability level was<br />
set at 5%. All <strong>SSR</strong> markers were <strong>in</strong>itially tested for<br />
their significance by simple regression analysis (R<br />
software version 2.8.1, 2006). Then, a QTL mapp<strong>in</strong>g<br />
was performed by composite <strong>in</strong>terval mapp<strong>in</strong>g<br />
(CIM) us<strong>in</strong>g W<strong>in</strong>dow QTL Car<strong>to</strong>grapher 2.5<br />
software (Wang et al., 2007). A <strong>to</strong>tal of 1,000<br />
permutations was performed on each trait for the
Vol. 44, No. 4, 2011 <strong>SSR</strong> markers <strong>in</strong> soybean 235<br />
empirical logarithm of the odd (LOD) threshold at<br />
the significant level 0.05. The QTL position was<br />
considered from LOD peaks at <strong>in</strong>dividual loci<br />
detected by maximum likelihood test at an<br />
<strong>in</strong>crement of 1.0 cM walk<strong>in</strong>g between the adjacent<br />
l<strong>in</strong>ked markers.<br />
Results <strong>and</strong> Discussion<br />
Phenotypes of <strong>Seed</strong> <strong>Traits</strong> <strong>and</strong> <strong>Oil</strong> <strong>Content</strong><br />
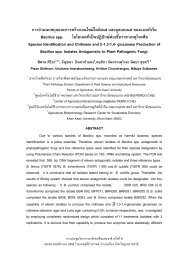
All traits <strong>in</strong> the F 2 population showed cont<strong>in</strong>uous<br />
distribution (Figure 1). Plant height, seed length,<br />
seed width, one hundred seed weight were normally<br />
distributed, whereas the other traits skewed <strong>to</strong>ward<br />
one end. The traits with normal distribution varied<br />
cont<strong>in</strong>uously from 0.43-1.57 m, 7.17-8.41 mm, 5.91-<br />
6.78 mm <strong>and</strong> 12.52-19.62 g, respectively (Table 1).<br />
The normality test of the F 2:3 population <strong>in</strong>dicated<br />
that number of nodes on ma<strong>in</strong> stem <strong>and</strong> <strong>to</strong>tal oil<br />
content were not normally distributed with the range<br />
of 12-25 nodes <strong>and</strong> 15.03-25.31%. Transgressive<br />
segregation was observed <strong>in</strong> all traits, reveal<strong>in</strong>g that<br />
the parents carry on alleles which contribute the<br />
effect <strong>in</strong> different direction when recomb<strong>in</strong>ed <strong>in</strong> the<br />
hybrids. It is an important mechanism contribut<strong>in</strong>g<br />
<strong>to</strong> adaptive evolution (Rieseberg et al., 1999;<br />
Rieseberg et al., 2003; Bell <strong>and</strong> Travis, 2005).<br />
(a)<br />
(b)<br />
60<br />
50<br />
mean±SD = 0.93±0.22<br />
skewness = 0.2967<br />
ku<strong>to</strong>sis = 0.1093<br />
p-value = 0.0911<br />
70<br />
60<br />
Laos 7122<br />
mean±SD = 18.19±2.44<br />
skewness = -0.0559<br />
ku<strong>to</strong>sis = -0.3313<br />
p-value = 0.0152<br />
Number of plants<br />
40<br />
30<br />
20<br />
Pak Chong 2<br />
Laos7122<br />
Fre<br />
Number of plants<br />
50<br />
40<br />
30<br />
20<br />
Pak Chong 2<br />
frequen<br />
10<br />
10<br />
0<br />
0.42-0.54 0.55-0.67 0.68-0.80 0.81-0.93 0.94-1.06 1.07-1.19 1.20-1.32 1.33-1.45 1.46-1.58<br />
0<br />
11-12 13-14 15-16 17-18 19-20 21-22 23-24 25-26 27-28<br />
Plant height (m)<br />
Number of nodes on ma<strong>in</strong> stem (nodes)<br />
(c)<br />
50<br />
45<br />
40<br />
35<br />
Laos 7122<br />
mean±SD = 7.75±0.23<br />
skewness = 0.1509<br />
ku<strong>to</strong>sis = -0.1594<br />
p-value = 0.7366<br />
(d)<br />
45<br />
40<br />
35<br />
30<br />
Pak Chong 2<br />
Laos 7122<br />
mean±SD = 6.34±0.18<br />
skewness = 0.0519<br />
ku<strong>to</strong>sis = -0.4693<br />
p-value = 0.1724<br />
Number of plants<br />
30<br />
25<br />
20<br />
15<br />
Pak Chong 2<br />
Fr<br />
Number of plants<br />
25<br />
20<br />
15<br />
Frequen<br />
10<br />
10<br />
5<br />
5<br />
0<br />
7.16-7.29 7.30-7.43 7.44-7.57 7.58-7.71 7.72-7.85 7.86-7.99 8.00-8.13 8.14-8.27 8.28-8.42<br />
<strong>Seed</strong> length (mm)<br />
0<br />
5.90-5.99 6.00-6.09 6.10-6.19 6.20-6.29 6.30-6.39 6.40-6.49 6.50-6.59 6.60-6.69 6.70-6.79<br />
<strong>Seed</strong> width (mm)<br />
(e)<br />
(f)<br />
Number of plants<br />
45<br />
40<br />
35<br />
30<br />
25<br />
20<br />
15<br />
Pak Chong 2<br />
Laos 7122<br />
mean±SD = 15.56±1.41<br />
skewness = 0.2663<br />
ku<strong>to</strong>sis = -0.2833<br />
p-value = 0.2380<br />
Fr<br />
Number of plants<br />
70<br />
60<br />
50<br />
40<br />
30<br />
20<br />
Pak Chong 2<br />
Laos 7122<br />
mean±SD = 18.88±1.41<br />
skewness = 0.9170<br />
kur<strong>to</strong>sis = 2.9333<br />
p-value =
236 J. Moongkanna et al. Thai Journal of Agricultural Science<br />
Table 1 Mean <strong>and</strong> range of plant height, number of nodes on ma<strong>in</strong> stem, seed length, seed width, 100-seed<br />
weight <strong>and</strong> <strong>to</strong>tal oil content <strong>in</strong> F 2:3 population from the soybean cross Pak Chong 2 × Laos 7122.<br />
Trait<br />
Mean±SD<br />
Pak Chong 2 Laos 7122 F 2:3 population<br />
Population range<br />
Plant height (mm) 0.77±0.03 0.70±0.04 0.93±0.22 0.43-1.57<br />
Number of nodes 16±1.14 18±1.25 18.19±2.44 12-25<br />
<strong>Seed</strong> length (mm) 7.51±0.05 7.90±0.35 7.75±0.23 7.17-8.41<br />
<strong>Seed</strong> width (mm) 6.22±0.05 6.59±0.08 6.34±0.18 5.91-6.78<br />
100 seed weight (g) 14.49±1.02 17.96±0.93 15.56±1.41 12.52-19.62<br />
<strong>Total</strong> oil content (%) 18.69±0.21 21.75±0.53 18.88±1.41 15.03-25.31<br />
<strong>SSR</strong> Genotyp<strong>in</strong>g<br />
Among 428 <strong>SSR</strong> primers surveyed <strong>in</strong> the<br />
parental l<strong>in</strong>es, 240 (56.07%) were polymorphic. Of<br />
these, 159 markers (66.25% of polymorphic<br />
markers) showed polymorphism among 186 F 2:3<br />
families. Based on the χ 2 test, out of 159 <strong>SSR</strong><br />
markers, 112 (70.44% of polymorphic markers)<br />
showed Mendelian segregation of 1:2:1, while the<br />
rest 47 markers exhibited dis<strong>to</strong>rtion ratios.<br />
L<strong>in</strong>kage Analysis<br />
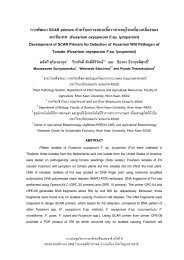
One hundred <strong>and</strong> thirty-eight <strong>SSR</strong> markers were<br />
mapped on<strong>to</strong> 30 l<strong>in</strong>kage groups (LGs) <strong>and</strong> covered<br />
1,921.1 cM of soybean genome (Figure 2). Twentyone<br />
polymorphic markers rema<strong>in</strong>ed unl<strong>in</strong>ked. The<br />
genetic map represented approximately two third of<br />
the consensus soybean map (2,523.6 cM; Song et al.,<br />
2004; Soybase, 2005). The l<strong>in</strong>kage groups consist of<br />
2 <strong>to</strong> 11 <strong>SSR</strong> markers with an average distance of 14<br />
cM between the adjacent loci. The length of the LGs<br />
varied from 13.9 <strong>to</strong> 218.0 cM. The shortest LG was<br />
F-1 (sub-group) while the longest one was D1b. The<br />
markers were dispersed but did not cover throughout<br />
the soybean genome. There were many gaps up <strong>to</strong><br />
50 cM <strong>in</strong> some LGs such as C1, because the map<br />
was constructed from the markers that may not be<br />
well-spread<strong>in</strong>g <strong>in</strong> the soybean genome.<br />
Figure 2 showed 11 LGs that were consistent<br />
with the consensus map of Cregan et al. (1999),<br />
consist<strong>in</strong>g of A1, B1, B2, C1, D1b, G, H, I, K, L<br />
<strong>and</strong> N. Eight LGs, viz A2, C2, D2, E, F, J, M <strong>and</strong><br />
O were split <strong>in</strong><strong>to</strong> 2 sub-groups, while D1a was<br />
divided <strong>in</strong><strong>to</strong> 3 sub-groups. Most markers<br />
constructed <strong>in</strong> LGs <strong>and</strong> the map position <strong>in</strong> this<br />
research corresponded well with the soybean<br />
composite map (Soybase, 2005), with some<br />
variation <strong>in</strong> l<strong>in</strong>kage distance between the markers.<br />
Some markers were mapped on the same LG as the<br />
reference map but the order of the markers was<br />
somewhat different, especially among the closely<br />
l<strong>in</strong>ked markers. Gene duplication was one reason<br />
caus<strong>in</strong>g marker allocation <strong>in</strong> different positions<br />
(Shoemaker et al., 1996; Soybase, 2005). Some<br />
markers with segregation dis<strong>to</strong>rtion may also affect<br />
the map position.<br />
QTL Analysis<br />
Both simple regression analysis (Table 2) <strong>and</strong><br />
composite <strong>in</strong>terval mapp<strong>in</strong>g (Table 3) were used <strong>to</strong><br />
identify <strong>SSR</strong> markers associated with the traits<br />
under study. The results of simple regression<br />
analysis showed that there were two <strong>SSR</strong> markers<br />
on LG-A1 <strong>in</strong>clud<strong>in</strong>g Satt236 <strong>and</strong> Satt258<br />
account<strong>in</strong>g for 7.90% <strong>and</strong> 6.12% of the <strong>to</strong>tal<br />
variation <strong>in</strong> plant height, respectively. Three<br />
markers consist<strong>in</strong>g of Satt313, Satt418 <strong>and</strong> Satt523<br />
on LG-L also l<strong>in</strong>ked <strong>to</strong> this trait (Table 2).<br />
However, analysis by CIM revealed no QTL for<br />
plant height but at least one QTL was detected for<br />
the other traits. The ma<strong>in</strong> reason that we were<br />
unable <strong>to</strong> locate the QTL for plant height because<br />
the difference between the parents was <strong>to</strong>o low<br />
(0.77 m for Pak Chong 2 <strong>and</strong>0.70 m for Laos 7122).<br />
The QTLs for plant height were reportedly located<br />
on l<strong>in</strong>kage group B1 (Zhang et al., 2004), N<br />
(Re<strong>in</strong>precht et al., 2006), F (Re<strong>in</strong>precht et al.,<br />
2006), C2 (Zhang et al., 2004; Re<strong>in</strong>precht et al.,<br />
2006), D1b (Kabelka et al., 2004; Re<strong>in</strong>precht et al.,<br />
2006), M (Zhang et al., 2004) <strong>and</strong> O (Re<strong>in</strong>precht et<br />
al., 2006).
Vol. 44, No. 4, 2011 <strong>SSR</strong> markers <strong>in</strong> soybean 237<br />
A1<br />
A2<br />
B1<br />
B2<br />
C1<br />
C2<br />
D1a<br />
D1b<br />
F<br />
D2<br />
E<br />
H<br />
J<br />
K<br />
N<br />
G<br />
L<br />
O<br />
I<br />
M<br />
Figure 2 A soybean genetic l<strong>in</strong>kage map developed from F 2:3 population from the cross Pak Chong 2 × Laos 7122 compris<strong>in</strong>g<br />
138 <strong>SSR</strong> markers group<strong>in</strong>g <strong>in</strong><strong>to</strong> 30 l<strong>in</strong>kage groups <strong>and</strong> spann<strong>in</strong>g 1,921.1 cM. The map shows marker position <strong>and</strong> estimated<br />
distance (cM) on the left-h<strong>and</strong> side <strong>and</strong> marker name on the right-h<strong>and</strong> side.<br />
There were three markers from simple<br />
regression analysis l<strong>in</strong>ked <strong>to</strong> number of nodes on<br />
ma<strong>in</strong> stem on LG-C2 (Sat_153), D1b (Satt537) <strong>and</strong><br />
L (Satt313), but only one QTL from CIM were<br />
found flank<strong>in</strong>g by Sat_153 <strong>and</strong> Satt322 on LG-C2<br />
<strong>and</strong> expla<strong>in</strong>ed 9.68% of <strong>to</strong>tal variation <strong>in</strong> this trait.<br />
Zhang et al. (2004) found QTLs of this trait on LG-<br />
A2, B1, C2, F <strong>and</strong> I.<br />
<strong>SSR</strong> markers associated with seed length were<br />
<strong>in</strong>itially identified on LG-B2, E, F, G <strong>and</strong> H via<br />
simple regression analysis (Table 2). CIM analysis<br />
located two QTLs on LG-C2 (Satt291 <strong>and</strong> Sat_153)<br />
<strong>and</strong> G (Sat_315 <strong>and</strong> Satt303), expla<strong>in</strong><strong>in</strong>g 8.13 <strong>and</strong><br />
11.10%, respectively via CIM. Only Satt303 on<br />
LG-G was found significant from both analytical<br />
methods.<br />
On the basis of simple regression analysis, there<br />
were many <strong>SSR</strong> markers associated with seed width<br />
located on LG-A2, B2, C2, E, G <strong>and</strong> L (Table 2).<br />
By CIM, there were three QTLs for this trait<br />
locat<strong>in</strong>g on LG-C2 (Satt291 <strong>and</strong> Sat_153), E<br />
(Satt045 <strong>and</strong> Satt699) <strong>and</strong> G (Satt303 <strong>and</strong> Satt504).<br />
They respectively expla<strong>in</strong>ed 10.88, 7.56 <strong>and</strong><br />
10.11% of the variation <strong>in</strong> seed width. Most<br />
markers which reported from CIM were the same<br />
as reported by simple regression analysis, except<br />
Sat_153.<br />
N<strong>in</strong>e <strong>SSR</strong> markers l<strong>in</strong>k<strong>in</strong>g <strong>to</strong> 100-seed weight<br />
were located on LG-E <strong>and</strong> G by simple regression<br />
analysis (Table 2). L<strong>in</strong>kage groups C2 <strong>and</strong> E<br />
harbor QTLs for this trait between Satt291 <strong>and</strong><br />
Sat_153 <strong>and</strong> Satt699 <strong>and</strong> Satt573 <strong>in</strong> the order by<br />
CIM. The QTLs accounted for 10.47 <strong>and</strong> 10.69%<br />
of the variation <strong>in</strong> seed weight, respectively (Figure<br />
3 <strong>and</strong> Table 3). Only QTL on LG-E via CIM was<br />
located on the same region as reported via simple<br />
regression analysis. QTLs for seed mass were<br />
earlier reported on LG-A2 (Zhang et al., 2004), B1<br />
(Zhang et al., 2004), B2 (Watanabe et al., 2004), C2<br />
(Hyten et al., 2004; Watanabe et al., 2004;
238 J. Moongkanna et al. Thai Journal of Agricultural Science<br />
Table 2 Simple regression for effect of <strong>in</strong>dividual markers on QTLs locat<strong>in</strong>g on 4 soybean l<strong>in</strong>kage groups.<br />
<strong>SSR</strong> LG %R 2 of trait<br />
Plant<br />
height<br />
Number of<br />
nodes<br />
<strong>Seed</strong><br />
length<br />
<strong>Seed</strong><br />
width<br />
100-<strong>Seed</strong><br />
weight<br />
<strong>Total</strong> oil<br />
content<br />
Sat_217 A1 - - - - - 21.99<br />
Satt200 A1 - - - - - 17.95<br />
Satt236 A1 7.90 - - - - 17.30<br />
Satt258 A1 6.12 - - - 23.92<br />
Sat_332 A2 - - - 5.97 - -<br />
Satt083 B2 - - 5.64 6.22 - -<br />
Sat_062 C2 - - - 7.36 - -<br />
Sat_153 C2 - 5.40 - - - -<br />
Satt291 C2 - - - 6.53 - -<br />
Satt537 D1b - 6.19 - - - -<br />
Satt045 E - - - 6.82 7.30 -<br />
Satt117 E - - - 6.45 - -<br />
Satt263 E - - - 7.20 6.43 -<br />
Satt268 E - - - 5.32 - -<br />
Satt369 E - - - 8.22 5.29 -<br />
Satt452 E - - - 7.82 5.71 -<br />
Satt573 E - - - 5.97 8.89 -<br />
Satt598 E - - - 5.65 6.72 -<br />
Satt699 E - - 5.60 9.64 10.00 -<br />
Satt348 F - - 7.11 - - -<br />
Sat_185 G - - 5.01 5.06 - -<br />
Satt303 G - - 6.97 8.22 5.76 -<br />
Satt400 G - - - 5.21 - -<br />
Satt504 G - - 5.87 7.22 5.66 -<br />
Sat_218 H - - 5.40 - - -<br />
Satt143 L - - - 5.04 - -<br />
Satt313 L 6.83 5.10 - - - -<br />
Satt418 L 6.45 - - - - -<br />
Satt523 L 5.46 - - - - -<br />
Re<strong>in</strong>precht et al., 2006), D1a (Hyten et al., 2004;<br />
Panthee et al., 2005), D2 (Zhang et al., 2004;<br />
Panthee et al., 2005; Liu et al., 2007), F (Hyten et<br />
al., 2004), G (Hyten et al., 2004), H (Watanabe et<br />
al., 2004; Liu et al., 2007), I (Hyten et al., 2004;<br />
Re<strong>in</strong>precht et al., 2006), J (Re<strong>in</strong>preht et al., 2006),<br />
K (Hyten et al., 2004; Watanabe et al., 2004), L<br />
(Hyten et al., 2004), M (Liu et al., 2007) <strong>and</strong> O (Liu<br />
et al., 2007).<br />
Three QTLs consist<strong>in</strong>g of SN6.1, <strong>Seed</strong>L6.1,<br />
SW6.1 were co-located on LG-C2 with the additive<br />
effect of -1.0013 nodes, 0.0739 mm <strong>and</strong> 0.5389 g,<br />
respectively. The alleles <strong>in</strong>creas<strong>in</strong>g number of<br />
nodes on ma<strong>in</strong> stem were from Laos 7122, while<br />
those <strong>in</strong>creas<strong>in</strong>g seed length <strong>and</strong> seed weigh were<br />
from Pak Chong 2. <strong>Seed</strong>W6.1 was overlapped <strong>to</strong><br />
these QTLs with the additive effect of 0.0769 mm<br />
(Table 3). <strong>Seed</strong>W15.1 <strong>and</strong> SW15.1 co-located on
Vol. 44, No. 4, 2011 <strong>SSR</strong> markers <strong>in</strong> soybean 239<br />
Table 3 Description of the QTLs controll<strong>in</strong>g traits <strong>in</strong> soybean under study on 4 LGs, as analyzed by composite <strong>in</strong>terval<br />
mapp<strong>in</strong>g.<br />
Trait QTL LG Position Flank<strong>in</strong>g LOD PVE Additive Dom<strong>in</strong>ant<br />
(cM)<br />
markers<br />
(%) effect effect<br />
Number of nodes SN6.1 C2 53.8 Sat_153-Satt322 3.7 9.68 -1.0013 0.3697<br />
<strong>Seed</strong> length (mm) <strong>Seed</strong>L6.1 C2 48.8 Satt291-Sat_153 3.5 8.13 0.0739 -0.0811<br />
<strong>Seed</strong>L18.1 G 51.4 Sat_315-Satt303 3.5 11.10 -0.0838 0.0962<br />
<strong>Seed</strong> width (mm) <strong>Seed</strong>W6.1 C2 34.0 Satt291-Sat_153 3.6 10.88 0.0769 -0.0372<br />
<strong>Seed</strong>W15.1 E 56.8 Satt045-Satt699 3.6 7.56 -0.0729 -0.0001<br />
<strong>Seed</strong>W18.1 G 52.4 Satt303-Satt504 3.6 10.11 -0.0811 0.0187<br />
100-seed weight (g) SW6.1 C2 43.0 Satt291-Sat_153 3.5 10.47 0.5389 -0.4446<br />
SW15.1 E 60.9 Satt699-Satt573 3.5 10.69 -0.6590 -0.0088<br />
<strong>Total</strong> oil content (%) OL5.1 A1 45.7 Satt200-Sat_217 3.5 27.16 0.9482 -0.5908<br />
OL5.2 A1 54.2 Sat_217-Satt258 3.5 45.18 1.0323 -0.4690<br />
A1<br />
C2<br />
E<br />
G<br />
0.0<br />
satt545<br />
0.0<br />
sat_062<br />
0.0<br />
satt491<br />
0.0<br />
sat_315<br />
37.7<br />
48.2<br />
57.9<br />
66.6<br />
satt200<br />
sat_217<br />
satt258<br />
satt236<br />
OL-1.1<br />
OL5.1<br />
OL5.2<br />
OL-1.2<br />
26.0<br />
48.8<br />
69.9<br />
satt291<br />
sat_153<br />
satt322<br />
SN-7.1<br />
SN-6.1<br />
<strong>Seed</strong>L-7.1<br />
<strong>Seed</strong>L6.1<br />
<strong>Seed</strong>W-7.1<br />
<strong>Seed</strong>W-6.1<br />
SW-7.1<br />
SW-6.1<br />
30.0<br />
31.7<br />
33.9<br />
37.3<br />
43.7<br />
57.9<br />
70.0<br />
73.6<br />
satt452<br />
satt117<br />
satt263<br />
satt268<br />
satt045<br />
satt699<br />
satt573<br />
satt598<br />
<strong>Seed</strong>W-15.1<br />
<strong>Seed</strong>W-16.1<br />
SW-15.1<br />
SW-16.1<br />
51.4<br />
58.8<br />
61.8<br />
68.6<br />
75.9<br />
satt303<br />
satt504<br />
satt400<br />
sat_185<br />
satt199<br />
<strong>Seed</strong>L-19.1<br />
<strong>Seed</strong>L-18.1<br />
<strong>Seed</strong>W-19.1<br />
<strong>Seed</strong>W-18.1<br />
86.3<br />
satt517<br />
110.0<br />
satt369<br />
120.2<br />
satt612<br />
129.7<br />
satt472<br />
138.5<br />
satt191<br />
150.2<br />
satt231<br />
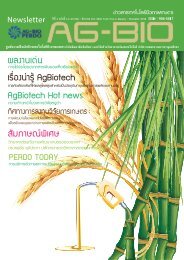
Figure 3 QTLs of 6 traits detected from F 2:3 population derived from Pak Chong 2 × Laos 7122 <strong>and</strong> found locat<strong>in</strong>g on four<br />
l<strong>in</strong>kage groups. These QTLs were found condition<strong>in</strong>g number of nodes on ma<strong>in</strong> stem (SN), seed length (<strong>Seed</strong>L), seed width<br />
(<strong>Seed</strong>W), one hundred seed weight (SW), <strong>to</strong>tal oil percentage (OL).<br />
LG-E with the additive effect of -0.0729 mm <strong>and</strong> -<br />
0.6590 g respectively. The alleles that <strong>in</strong>crease<br />
seed width <strong>and</strong> seed weight were both from Laos<br />
7122. <strong>Seed</strong>L18.1 <strong>and</strong> <strong>Seed</strong>W18.1 co-located on<br />
LG-G with the additive effect of -0.0838 mm <strong>and</strong> -<br />
0.0811 mm, respectively. The alleles <strong>in</strong>creased<br />
seed length <strong>and</strong> seed width were from Laos 7122.<br />
Alleles from Pak Chong 2 <strong>in</strong>creased seed length,<br />
seed width <strong>and</strong> seed weight but decreased number<br />
of nodes on ma<strong>in</strong> stem. These relationships showed<br />
that it was rather difficult <strong>to</strong> improve all these traits<br />
at the same time.<br />
Our research found one QTL for number of<br />
nodes on ma<strong>in</strong> stem, two QTLs for seed length,<br />
three QTLs for seed width <strong>and</strong> two QTLs for 100-<br />
seed weight. Although many markers were found,<br />
their contribution was small <strong>and</strong> no major QTL was<br />
observed.
240 J. Moongkanna et al. Thai Journal of Agricultural Science<br />
Similar results from simple regression analysis<br />
<strong>and</strong> CIM were detected <strong>in</strong> two major QTLs l<strong>in</strong>ked<br />
<strong>to</strong> <strong>to</strong>tal oil content on LG-A1. One QTL locates<br />
between Satt200 <strong>and</strong> Sat_217 which expla<strong>in</strong>s<br />
27.16% of the <strong>to</strong>tal variation, while the other<br />
locates between Sat_217 <strong>and</strong> Satt258 <strong>and</strong> accounts<br />
for 45.18%. Although the difference <strong>in</strong> oil content<br />
between parents is not large, it is possible that they<br />
are different <strong>in</strong> loci controll<strong>in</strong>g this trait <strong>and</strong> thus<br />
caus<strong>in</strong>g transgressive segregation among the<br />
progenies. Diers et al. (1992) reported markers<br />
l<strong>in</strong>ked <strong>to</strong> oil content on LG-A. The other QTLs for<br />
oil content were found on LG-A2 (Tajudd<strong>in</strong> et al.,<br />
2003), B2 (Tajudd<strong>in</strong> et al., 2003), C1 (Lee et al.,<br />
1996), C2 (Hyten et al., 2004), D1a (Hyten et al.,<br />
2004), D1b (Kabelka et al., 2004; Panthee et al.,<br />
2005), D2 (Hyten et al., 2004), E (Lee et al., 1996;<br />
Re<strong>in</strong>precht et al., 2006; Shibata et al., 2008), H<br />
(Lee et al., 1996; Panthee et al., 2005), I (Lee et al.,<br />
1996; Tajudd<strong>in</strong> et al., 2003; Shibata et al., 2008), J<br />
(Tajudd<strong>in</strong> et al., 2003), G (Lee et al., 1996;<br />
Re<strong>in</strong>precht et al., 2006), L (Hyten et al., 2004;<br />
Re<strong>in</strong>precht et al., 2006), M (Tajudd<strong>in</strong> et al., 2003;<br />
Hyten et al., 2004) <strong>and</strong> O (Tajudd<strong>in</strong> et al., 2003,<br />
Panthee et al., 2005).<br />
None of markers located on LG-A1 has been<br />
reported l<strong>in</strong>k<strong>in</strong>g <strong>to</strong> <strong>to</strong>tal oil content <strong>in</strong> the past so<br />
Satt200, Sat_217 <strong>and</strong> Satt258 are novel markers.<br />
Two QTLs of <strong>to</strong>tal oil content l<strong>in</strong>k<strong>in</strong>g <strong>to</strong> OL5.1 <strong>and</strong><br />
OL5.2 were overlapped on LG-A1. Their additive<br />
effects were 0.9482% <strong>and</strong> 1.0323%, respectively.<br />
Both alleles from Pak Chong 2 <strong>in</strong>creased <strong>to</strong>tal oil<br />
content. Figure 3 presents four l<strong>in</strong>kage groups viz.<br />
A1, C2, E <strong>and</strong> G harbor<strong>in</strong>g 10 QTLs of six traits<br />
upon CIM. The traits revealed no QTL on the other<br />
16 l<strong>in</strong>kage groups, viz. A2, B1, B2, C1, D1a, D1b,<br />
F, G, H, I, J, K, L, M, N <strong>and</strong> O.<br />
Conclusions<br />
Two major QTLs for <strong>to</strong>tal oil content on LG-A1<br />
were identified <strong>and</strong> thus can be used <strong>in</strong> breed<strong>in</strong>g <strong>to</strong><br />
improve oil content <strong>in</strong> soybean.<br />
Acknowledgments<br />
This research was supported by (1) The Royal<br />
Golden Jubilee (RGJ) Scholarship <strong>and</strong> The Project<br />
on Genetics <strong>and</strong> Breed<strong>in</strong>g of Field Legumes for<br />
Thail<strong>and</strong> of the Thail<strong>and</strong> Research Fund (TRF), (2)<br />
the Center for Agricultural Biotechnology of<br />
Kasetsart University, (3) Center of Excellence on<br />
Agricultural Biotechnology: (AG-BIO/PERDO-<br />
CHE), Thail<strong>and</strong>. The authors acknowledge Dr.<br />
Joseph W Bur<strong>to</strong>n, Dr. Jim B Holl<strong>and</strong> <strong>and</strong> Dr.<br />
Andrea J Card<strong>in</strong>al from the USDA-ARS <strong>and</strong> the<br />
North Carol<strong>in</strong>a Agricultural Research Service<br />
(Raleigh, NC) for technical assistance <strong>and</strong> helpful<br />
suggestions, <strong>and</strong> Dr. Amornrat Promboon <strong>and</strong> Dr.<br />
Chongrak Kaewprasit of Kasetsart University for<br />
their k<strong>in</strong>d advices.<br />
References<br />
Bell, M.A. <strong>and</strong> M.P. Travis. 2005. Hybridization,<br />
transgressive segregation, genetic covariation, <strong>and</strong><br />
adaptive radiation. Trends Ecol. Evol. 20: 358-361.<br />
Cregan, P.B., T. Jarvik, A.L. Bush, R.C. Shoemaker,<br />
K.G. Lark, A.L. Kahler, N. Kaya, T.T. Van Toai,<br />
D.G. Lohnes, J. Chung <strong>and</strong> A.L. Specht. 1999. An<br />
<strong>in</strong>tegrated genetic map of soybean genome. Crop<br />
Sci. 39: 1464-1490.<br />
Diers, B.W., P. Keim, W.R. Fehr <strong>and</strong> R.C. Shoemaker.<br />
1992. RFLP analysis of soybean seed prote<strong>in</strong> <strong>and</strong> oil<br />
content. Theor. Appl. Genet. 83: 608-612.<br />
Hildebr<strong>and</strong>, D.F., R. Li <strong>and</strong> T. Hatanaka. 2008.<br />
Chapter12: genomics of soybean oil traits, pp. 185-<br />
209. In: G. Stacey, ed., Genomics <strong>and</strong> Genetics of<br />
<strong>Soybean</strong>. Spr<strong>in</strong>ger, New York.<br />
Hyten, D.L., V.R. Pantalone, C.E. Sams, A.M. Sax<strong>to</strong>n,<br />
D.L. Ellis, T.R. Stefaniak <strong>and</strong> M.E. Schmid. 2004.<br />
<strong>Seed</strong> quality QTL <strong>in</strong> a prom<strong>in</strong>ent soybean<br />
population. Theor. Appl. Genet. 109: 552-561.<br />
Kabelka, E.A., B.W. Diers, W.R. Fehr, A.R. LeRoy, I.C.<br />
Baianu, T. You, D.J. Neece <strong>and</strong> R.L. Nelson. 2004.<br />
Putative alleles for <strong>in</strong>creased yield from soybean<br />
plant <strong>in</strong>troduction. Crop Sci. 44: 784-791.<br />
Lee, S.H., M.A. Bailey, M.A.R. Mian, T.E. Carter, E.R.<br />
Shipe, D.A. Ashley, W.A. Parrott, R.S. Hussey <strong>and</strong><br />
H.R. Boerma. 1996. RFLP loci associated with<br />
soybean prote<strong>in</strong> <strong>and</strong> oil content across population <strong>and</strong><br />
location. Theor. Appl. Genet. 93: 649-657.<br />
Liu, K. 1997. Chemistry <strong>and</strong> nutritional value of soybean<br />
components, pp. 25-35. In <strong>Soybean</strong>: Chemistry,<br />
Technology <strong>and</strong> Utilization. Aspen Publishers,<br />
Gaithersburg, MD.<br />
Liu, B., T. Fujita, Z. Yan, S. Sakamo<strong>to</strong>, D. Xu <strong>and</strong> J.<br />
Abe. 2007. QTL mapp<strong>in</strong>g of domestication-related<br />
traits <strong>in</strong> soybean (Glyc<strong>in</strong>e max). Annals of Botany.<br />
100: 1027-1038.<br />
Lodhi, M.A., G.N. Ye, N.F. Weeden <strong>and</strong> B.I. Reisch.<br />
1994. A simple <strong>and</strong> efficient method for DNA<br />
extraction from grapev<strong>in</strong>e cultivars <strong>and</strong> Vitis species.<br />
Plant Mol. Biol. Rep. 12: 6-13.<br />
Office of Agricultural Economics. 2010. M<strong>in</strong>istry of<br />
Agriculture <strong>and</strong> Cooperatives. Amount <strong>and</strong> imported
Vol. 44, No. 4, 2011 <strong>SSR</strong> markers <strong>in</strong> soybean 241<br />
agricultural products: soybean. Amount <strong>and</strong> value of<br />
monthly imported agricultural products. Available<br />
source: http://www.oae.go.th/statistic/import/imSY.xls,<br />
April 18, 2011.<br />
Panthee, D.R., V.R. Pantalone, D.R. West, A.M. Sax<strong>to</strong>n<br />
<strong>and</strong> C.E. Sams. 2005. Quantitative trait loci for seed<br />
prote<strong>in</strong> <strong>and</strong> oil concentration, <strong>and</strong> seed size <strong>in</strong><br />
soybean. Crop Sci. 45: 2015-2022.<br />
R Development Core Team. 2006. R: a language <strong>and</strong><br />
environment for statistical comput<strong>in</strong>g. R foundation<br />
for statistical comput<strong>in</strong>g, Vienna, Austria, ISBN: 3-<br />
900051-07-0. http://R-project.org.<br />
Re<strong>in</strong>precht, Y., V.W. Poysa, K. Yu, I. Rajcan, G.R.<br />
Ablett <strong>and</strong> K.P. Pauls. 2006. <strong>Seed</strong> <strong>and</strong> agronomic QTL<br />
<strong>in</strong> low l<strong>in</strong>olenic acid, lipoxygenase-free soybean<br />
(Glyc<strong>in</strong>e max (L.) Merrill) germplasm. Gonome 49:<br />
1510-1527.<br />
Rieseberg, L.H., M.A. Archer <strong>and</strong> R.K. Wayne. 1999.<br />
Transgressive segregation, adaptation <strong>and</strong> speciation.<br />
Heredity 20: 363-372.<br />
Rieseberg, L.H., A. Widmer, A.M. Arntz <strong>and</strong> J.M.<br />
Burke. 2003. The genetic architecture necessary for<br />
transgressive segregation is common <strong>in</strong> both natural<br />
<strong>and</strong> domesticated populations. Phil. Trans. R. Soc.<br />
Lond. B. 358: 1141-1147.<br />
Shibata, M., K. Takayama, A. Ujiie, T. Yamada, J. Abe<br />
<strong>and</strong> K. Kitamura. 2008. Genetic relationship between<br />
lipid content <strong>and</strong> l<strong>in</strong>olenic acid concentration <strong>in</strong><br />
soybean seeds. Breed<strong>in</strong>g Sci. 58: 361-366.<br />
Shoemaker, R.C., K. Polz<strong>in</strong>, J. Labate, J. Specht, E.C.<br />
Brummer, T. Olson, N. Young, V. Concibido, J.<br />
Wilcox, J.P. Tamulonis, G. Kochert <strong>and</strong> H.R. Boerma.<br />
1996. Genome duplication <strong>in</strong> soybean (Glyc<strong>in</strong>e<br />
subgenus soja). Genetics 144: 329-338.<br />
Song, Q.J., L.F. Marek, R.C. Shoemaker, K.G. Lark,<br />
V.C. Concibido, X. Delannay, J.E. Specht <strong>and</strong> P.B.<br />
Cregan. 2004. A new <strong>in</strong>tegrated genetic l<strong>in</strong>kage<br />
map of soybean. Theor. Appl. Genet. 109: 122-128.<br />
Soybase 2005. Available from http://Soybase.org, 31<br />
January 2011.<br />
Tajudd<strong>in</strong>, T., S. Watanabe, N. Yamanaka <strong>and</strong> K. Harada.<br />
2003. Analysis of quantitative trait loci for prote<strong>in</strong><br />
<strong>and</strong> lipid contents <strong>in</strong> soybean seed us<strong>in</strong>g recomb<strong>in</strong>ant<br />
<strong>in</strong>bred l<strong>in</strong>es. Breed<strong>in</strong>g Sci. 53: 133-140.<br />
Van Ooijen, J.W. <strong>and</strong> R.E. Voorrips. 2001. Jo<strong>in</strong>Map ® 3.0:<br />
software for the calculation of genetic l<strong>in</strong>kage maps.<br />
Plant Research International, Wagen<strong>in</strong>gen.<br />
Wang, S., C.J. Basten <strong>and</strong> Z.B. Zeng. 2007. W<strong>in</strong>dows<br />
QTL car<strong>to</strong>grapger 2.5. Department of Statistics,<br />
North Carol<strong>in</strong>a State University, Raleigh, N.C.<br />
Available from http://statgen.ncsu.edu/qtlcart/WQTL<br />
Cart.htm.<br />
Watanabe, S., T. Tajudd<strong>in</strong>, N. Yamanaka <strong>and</strong> K. Harada.<br />
2004. Analysis of QTLs for reproductive development<br />
<strong>and</strong> seed quality traits <strong>in</strong> soybean us<strong>in</strong>g recomb<strong>in</strong>ant<br />
<strong>in</strong>bred l<strong>in</strong>es. Breed<strong>in</strong>g Sci. 54: 399-407.<br />
Zhang, W.K., Y.J. Wang, G.Z. Luo, J.S. Zhang, C.Y. He,<br />
X.L. Wu, J.Z. Gai <strong>and</strong> S.Y. Chen. 2004. QTL mapp<strong>in</strong>g<br />
of ten agronomic traits on the soybean (Glyc<strong>in</strong>e max<br />
(L.) Merr.) genetic map <strong>and</strong> their association with EST<br />
markers. Theor. Appl. Genet. 108: 1131-1139.<br />
Manuscript received 16 August 2011, accepted 2 December 2011<br />
Now onl<strong>in</strong>e at http://www.thaiagj.org