Reproductive Ecology and Body Burden of Resident ... - The Love Lab
Reproductive Ecology and Body Burden of Resident ... - The Love Lab
Reproductive Ecology and Body Burden of Resident ... - The Love Lab

Create successful ePaper yourself
Turn your PDF publications into a flip-book with our unique Google optimized e-Paper software.
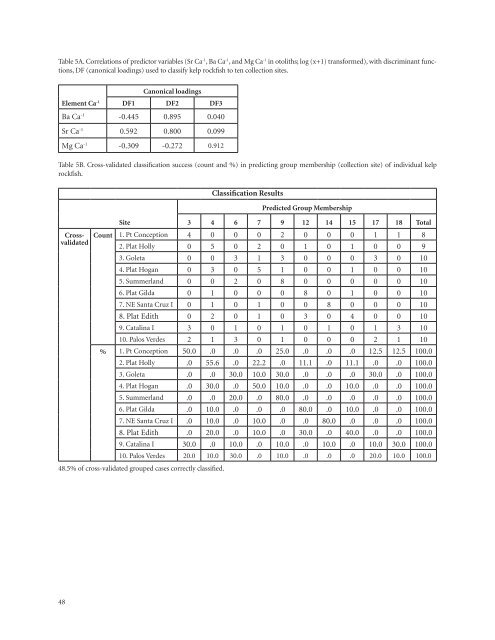
Table 5A. Correlations <strong>of</strong> predictor variables (Sr Ca -1 , Ba Ca -1 , <strong>and</strong> Mg Ca -1 in otoliths; log (x+1) transformed), with discriminant functions,<br />
DF (canonical loadings) used to classify kelp rockfish to ten collection sites.<br />
Element Ca -1<br />
Canonical loadings<br />
DF1 DF2 DF3<br />
Ba Ca -1 -0.445 0.895 0.040<br />
Sr Ca -1 0.592 0.800 0.099<br />
Mg Ca -1 -0.309 -0.272 0.912<br />
Table 5B. Cross-validated classification success (count <strong>and</strong> %) in predicting group membership (collection site) <strong>of</strong> individual kelp<br />
rockfish.<br />
Crossvalidated<br />
Site<br />
Classification Results<br />
Predicted Group Membership<br />
3 4 6 7 9 12 14 15 17 18 Total<br />
Count 1. Pt Conception 4 0 0 0 2 0 0 0 1 1 8<br />
2. Plat Holly 0 5 0 2 0 1 0 1 0 0 9<br />
3. Goleta 0 0 3 1 3 0 0 0 3 0 10<br />
4. Plat Hogan 0 3 0 5 1 0 0 1 0 0 10<br />
5. Summerl<strong>and</strong> 0 0 2 0 8 0 0 0 0 0 10<br />
6. Plat Gilda 0 1 0 0 0 8 0 1 0 0 10<br />
7. NE Santa Cruz I 0 1 0 1 0 0 8 0 0 0 10<br />
8. Plat Edith 0 2 0 1 0 3 0 4 0 0 10<br />
9. Catalina I 3 0 1 0 1 0 1 0 1 3 10<br />
10. Palos Verdes 2 1 3 0 1 0 0 0 2 1 10<br />
% 1. Pt Conception 50.0 .0 .0 .0 25.0 .0 .0 .0 12.5 12.5 100.0<br />
2. Plat Holly .0 55.6 .0 22.2 .0 11.1 .0 11.1 .0 .0 100.0<br />
3. Goleta .0 .0 30.0 10.0 30.0 .0 .0 .0 30.0 .0 100.0<br />
4. Plat Hogan .0 30.0 .0 50.0 10.0 .0 .0 10.0 .0 .0 100.0<br />
5. Summerl<strong>and</strong> .0 .0 20.0 .0 80.0 .0 .0 .0 .0 .0 100.0<br />
6. Plat Gilda .0 10.0 .0 .0 .0 80.0 .0 10.0 .0 .0 100.0<br />
7. NE Santa Cruz I .0 10.0 .0 10.0 .0 .0 80.0 .0 .0 .0 100.0<br />
8. Plat Edith .0 20.0 .0 10.0 .0 30.0 .0 40.0 .0 .0 100.0<br />
9. Catalina I 30.0 .0 10.0 .0 10.0 .0 10.0 .0 10.0 30.0 100.0<br />
10. Palos Verdes 20.0 10.0 30.0 .0 10.0 .0 .0 .0 20.0 10.0 100.0<br />
48.5% <strong>of</strong> cross-validated grouped cases correctly classified.<br />
48