ANNUAL REPORT AND ACCOUNTS 2012 - RSA, Annual Report ...
ANNUAL REPORT AND ACCOUNTS 2012 - RSA, Annual Report ...
ANNUAL REPORT AND ACCOUNTS 2012 - RSA, Annual Report ...

Create successful ePaper yourself
Turn your PDF publications into a flip-book with our unique Google optimized e-Paper software.
FINANCIAL STATEMENTS<br />
At 31 December <strong>2012</strong> there are derivative contracts in place to protect the value of the UK, Canadian, European, and US equity portfolios<br />
of the Group. These provide limited protection against declines in market levels whilst also capping participation in any appreciation of the<br />
market. In total, this strategy covers an underlying equity value up to approximately £348m (2011: £477m). If UK, Canadian, European and<br />
US equity markets decreased by 15%, the impact of these derivatives as at 31 December <strong>2012</strong>, would be to decrease the impact of the<br />
decline by £26m (2011: £30m).<br />
During 2011 the Group entered into a series of swap contracts which collectively provide limited cover against a sharp increase in longterm<br />
inflation. In total the swap contracts provide inflation cover over a nominal value of £180m (2011: £180m) and are split over different<br />
contract terms.<br />
At 31 December <strong>2012</strong> the Group holds currency forward contracts and foreign exchange options that are designated as hedging instruments to<br />
reduce structural foreign exchange risk. The derivatives are included in the table above. Further information on designated hedges can be found<br />
in note 28.<br />
Sensitivity analysis<br />
The Group uses a number of sensitivity or stress test-based risk management tools to understand the impact of the above risks on earnings<br />
and capital in both normal and stressed conditions. These stress tests combine deterministic shocks, analysis of historical scenarios and<br />
stochastic modelling using the internal capital model to inform the Group’s decision making and planning process and also for identification<br />
and management of risks within the business units.<br />
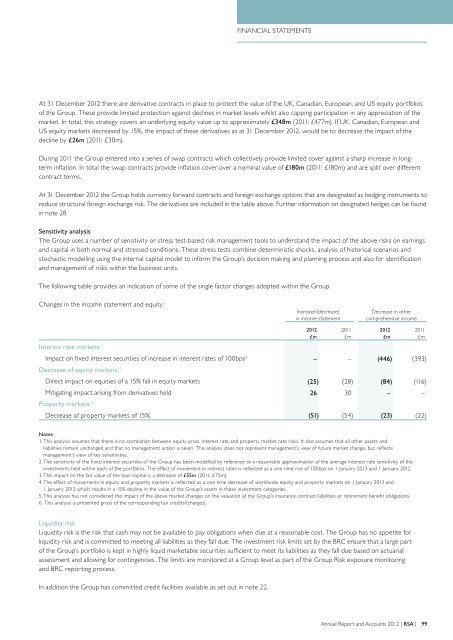
The following table provides an indication of some of the single factor changes adopted within the Group.<br />
Changes in the income statement and equity:<br />
Increase/(decrease)<br />
in income statement<br />
Decrease in other<br />
comprehensive income<br />
Interest rate markets: 2<br />
Impact on fixed interest securities of increase in interest rates of 100bps 3 – – (446) (393)<br />
Decrease of equity markets: 4<br />
Direct impact on equities of a 15% fall in equity markets (25) (28) (84) (116)<br />
Mitigating impact arising from derivatives held 26 30 – –<br />
Property markets: 4<br />
Decrease of property markets of 15% (51) (54) (23) (22)<br />
<strong>2012</strong><br />
£m<br />
2011<br />
£m<br />
<strong>2012</strong><br />
£m<br />
2011<br />
£m<br />
Notes:<br />
1. This analysis assumes that there is no correlation between equity price, interest rate and property market rate risks. It also assumes that all other assets and<br />
liabilities remain unchanged and that no management action is taken. This analysis does not represent management’s view of future market change, but reflects<br />
management’s view of key sensitivities.<br />
2. The sensitivity of the fixed interest securities of the Group has been modelled by reference to a reasonable approximation of the average interest rate sensitivity of the<br />
investments held within each of the portfolios. The effect of movement in interest rates is reflected as a one time rise of 100bps on 1 January 2013 and 1 January <strong>2012</strong>.<br />
3. The impact on the fair value of the loan capital is a decrease of £55m (2011: £75m).<br />
4. The effect of movements in equity and property markets is reflected as a one time decrease of worldwide equity and property markets on 1 January 2013 and<br />
1 January <strong>2012</strong> which results in a 15% decline in the value of the Group’s assets in these investment categories.<br />
5. This analysis has not considered the impact of the above market changes on the valuation of the Group’s insurance contract liabilities or retirement benefit obligations.<br />
6. This analysis is presented gross of the corresponding tax credits/(charges).<br />
Liquidity risk<br />
Liquidity risk is the risk that cash may not be available to pay obligations when due at a reasonable cost. The Group has no appetite for<br />
liquidity risk and is committed to meeting all liabilities as they fall due. The investment risk limits set by the BRC ensure that a large part<br />
of the Group’s portfolio is kept in highly liquid marketable securities sufficient to meet its liabilities as they fall due based on actuarial<br />
assessment and allowing for contingencies. The limits are monitored at a Group level as part of the Group Risk exposure monitoring<br />
and BRC reporting process.<br />
In addition the Group has committed credit facilities available as set out in note 22.<br />
<strong>Annual</strong> <strong>Report</strong> and Accounts <strong>2012</strong> | <strong>RSA</strong> | 99