Dynamic SIMS - CasaXPS
Dynamic SIMS - CasaXPS
Dynamic SIMS - CasaXPS

Create successful ePaper yourself
Turn your PDF publications into a flip-book with our unique Google optimized e-Paper software.
<strong>CasaXPS</strong> Manual 2.3.15 Rev 1.0<br />
Copyright © 2010 Casa Software Ltd<br />
initial mass calibration and application of the Find Peaks button, the set of<br />
regions generated by the Find Peaks button in Figure 10 are limited by the<br />
Load Regions button to those displayed in Figure 9. That is, all regions above<br />
nominal mass 31 were sufficiently different from the nominal mass to be<br />
rejected. The deviation of the computed mass for peaks above 31 amu from<br />
the nominal mass is a measure of the error in the original mass calibration.<br />
Given the new set of calibration points, the Calib button on the Exact Mass<br />
property page can be pressed resulting in an improved mass calibration.<br />
Repeating the Find Peaks operation followed by reloading the regions into<br />
the calibration table reveals that peaks up to 53 amu are now included in the<br />
calibration table. A third iteration of these steps produced a calibration table<br />
including peaks up to 228 amu, while a forth iteration extends the calibration<br />
table up to 561 amu, exhausting the set of peaks found using the Find Peaks<br />
button. The mass calibration based on nominal masses is now complete. All<br />
that remains is to verify the mass calibration by stepping through the spectral<br />
peaks to confirm the presence of peaks at each amu and that known peaks<br />
are correctly assigned.<br />
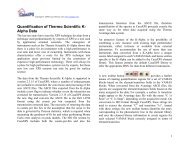
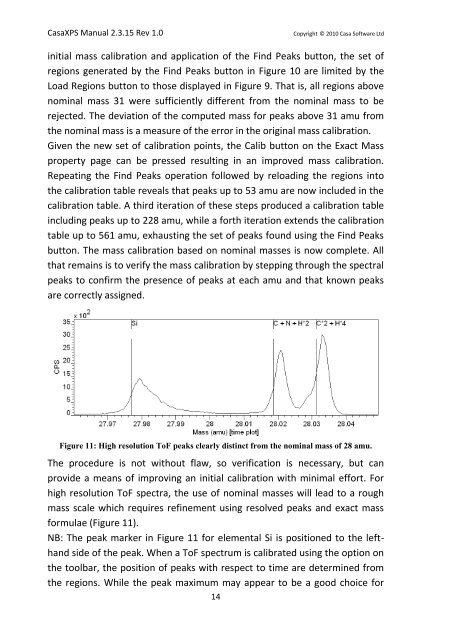
Figure 11: High resolution ToF peaks clearly distinct from the nominal mass of 28 amu.<br />
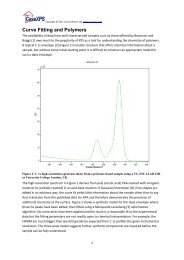
The procedure is not without flaw, so verification is necessary, but can<br />
provide a means of improving an initial calibration with minimal effort. For<br />
high resolution ToF spectra, the use of nominal masses will lead to a rough<br />
mass scale which requires refinement using resolved peaks and exact mass<br />
formulae (Figure 11).<br />
NB: The peak marker in Figure 11 for elemental Si is positioned to the lefthand<br />
side of the peak. When a ToF spectrum is calibrated using the option on<br />
the toolbar, the position of peaks with respect to time are determined from<br />
the regions. While the peak maximum may appear to be a good choice for<br />
14