Chapter 15 Internal Migration in Nepal - Central Bureau of Statistics
Chapter 15 Internal Migration in Nepal - Central Bureau of Statistics
Chapter 15 Internal Migration in Nepal - Central Bureau of Statistics

You also want an ePaper? Increase the reach of your titles
YUMPU automatically turns print PDFs into web optimized ePapers that Google loves.
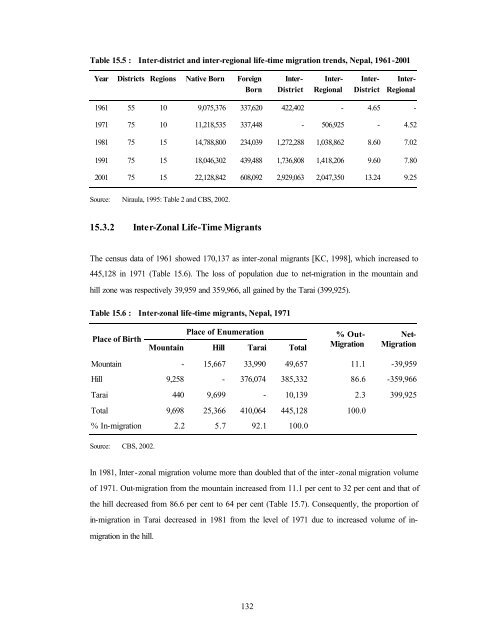
Table <strong>15</strong>.5 : Inter-district and <strong>in</strong>ter-regional life-time migration trends, <strong>Nepal</strong>, 1961-2001<br />
Year Districts Regions Native Born Foreign<br />
Born<br />
Inter-<br />
District<br />
Inter-<br />
Regional<br />
Inter-<br />
District<br />
Inter-<br />
Regional<br />
1961 55 10 9,075,376 337,620 422,402 - 4.65 -<br />
1971 75 10 11,218,535 337,448 - 506,925 - 4.52<br />
1981 75 <strong>15</strong> 14,788,800 234,039 1,272,288 1,038,862 8.60 7.02<br />
1991 75 <strong>15</strong> 18,046,302 439,488 1,736,808 1,418,206 9.60 7.80<br />
2001 75 <strong>15</strong> 22,128,842 608,092 2,929,063 2,047,350 13.24 9.25<br />
Source: Niraula, 1995: Table 2 and CBS, 2002.<br />
<strong>15</strong>.3.2 Inter-Zonal Life-Time Migrants<br />
The census data <strong>of</strong> 1961 showed 170,137 as <strong>in</strong>ter-zonal migrants [KC, 1998], which <strong>in</strong>creased to<br />
445,128 <strong>in</strong> 1971 (Table <strong>15</strong>.6). The loss <strong>of</strong> population due to net-migration <strong>in</strong> the mounta<strong>in</strong> and<br />
hill zone was respectively 39,959 and 359,966, all ga<strong>in</strong>ed by the Tarai (399,925).<br />
Table <strong>15</strong>.6 : Inter-zonal life-time migrants, <strong>Nepal</strong>, 1971<br />
Place <strong>of</strong> Enumeration<br />
Place <strong>of</strong> Birth<br />
Mounta<strong>in</strong> Hill Tarai Total<br />
% Out-<br />
<strong>Migration</strong><br />
Net-<br />
<strong>Migration</strong><br />
Mounta<strong>in</strong> - <strong>15</strong>,667 33,990 49,657 11.1 -39,959<br />
Hill 9,258 - 376,074 385,332 86.6 -359,966<br />
Tarai 440 9,699 - 10,139 2.3 399,925<br />
Total 9,698 25,366 410,064 445,128 100.0<br />
% In-migration 2.2 5.7 92.1 100.0<br />
Source: CBS, 2002.<br />
In 1981, Inter-zonal migration volume more than doubled that <strong>of</strong> the <strong>in</strong>ter -zonal migration volume<br />
<strong>of</strong> 1971. Out-migration from the mounta<strong>in</strong> <strong>in</strong>creased from 11.1 per cent to 32 per cent and that <strong>of</strong><br />
the hill decreased from 86.6 per cent to 64 per cent (Table <strong>15</strong>.7). Consequently, the proportion <strong>of</strong><br />
<strong>in</strong>-migration <strong>in</strong> Tarai decreased <strong>in</strong> 1981 from the level <strong>of</strong> 1971 due to <strong>in</strong>creased volume <strong>of</strong> <strong>in</strong>migration<br />
<strong>in</strong> the hill.<br />
132