Chapter 15 Internal Migration in Nepal - Central Bureau of Statistics
Chapter 15 Internal Migration in Nepal - Central Bureau of Statistics
Chapter 15 Internal Migration in Nepal - Central Bureau of Statistics

You also want an ePaper? Increase the reach of your titles
YUMPU automatically turns print PDFs into web optimized ePapers that Google loves.
l<strong>in</strong>e and every other person <strong>in</strong> the rural area is poor (NPC, 2003). Very high unemployment and<br />
underemployment rates <strong>of</strong> 17.4 and 32.3 per cent (NPC, 2003: 58, 99) have compelled people to<br />
rema<strong>in</strong> either under severe poverty or migrate to other places with<strong>in</strong> and outside the country for<br />
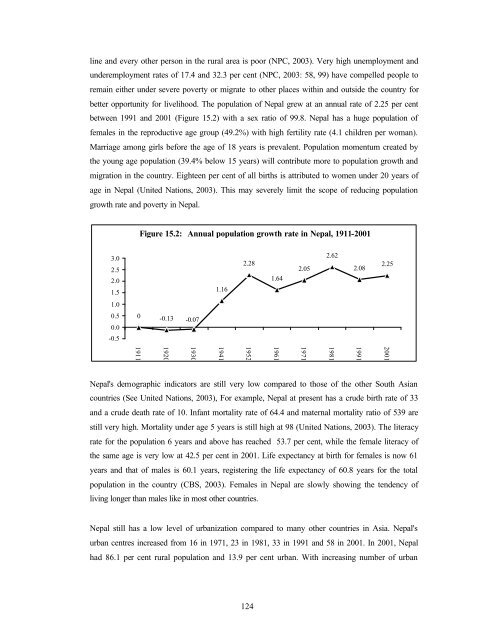
better opportunity for livelihood. The population <strong>of</strong> <strong>Nepal</strong> grew at an annual rate <strong>of</strong> 2.25 per cent<br />
between 1991 and 2001 (Figure <strong>15</strong>.2) with a sex ratio <strong>of</strong> 99.8. <strong>Nepal</strong> has a huge population <strong>of</strong><br />
females <strong>in</strong> the reproductive age group (49.2%) with high fertility rate (4.1 children per woman).<br />
Marriage among girls before the age <strong>of</strong> 18 years is prevalent. Population momentum created by<br />
the young age population (39.4% below <strong>15</strong> years) will contribute more to population growth and<br />
migration <strong>in</strong> the country. Eighteen per cent <strong>of</strong> all births is attributed to women under 20 years <strong>of</strong><br />
age <strong>in</strong> <strong>Nepal</strong> (United Nations, 2003). This may severely limit the scope <strong>of</strong> reduc<strong>in</strong>g population<br />
growth rate and poverty <strong>in</strong> <strong>Nepal</strong>.<br />
Figure <strong>15</strong>.2: Annual population growth rate <strong>in</strong> <strong>Nepal</strong>, 1911-2001<br />
3.0<br />
2.5<br />
2.0<br />
1.5<br />
1.16<br />
2.28<br />
1.64<br />
2.05<br />
2.62<br />
2.08<br />
2.25<br />
1.0<br />
0.5<br />
0.0<br />
-0.5<br />
0 -0.13<br />
-0.07<br />
2001<br />
1991<br />
1981<br />
1971<br />
1961<br />
1952/54<br />
1941<br />
1930<br />
1920<br />
1911<br />
<strong>Nepal</strong>'s demographic <strong>in</strong>dicators are still very low compared to those <strong>of</strong> the other South Asian<br />
countries (See United Nations, 2003), For example, <strong>Nepal</strong> at present has a crude birth rate <strong>of</strong> 33<br />
and a crude death rate <strong>of</strong> 10. Infant mortality rate <strong>of</strong> 64.4 and maternal mortality ratio <strong>of</strong> 539 are<br />
still very high. Mortality under age 5 years is still high at 98 (United Nations, 2003). The literacy<br />
rate for the population 6 years and above has reached 53.7 per cent, while the female literacy <strong>of</strong><br />
the same age is very low at 42.5 per cent <strong>in</strong> 2001. Life expectancy at birth for females is now 61<br />
years and that <strong>of</strong> males is 60.1 years, register<strong>in</strong>g the life expectancy <strong>of</strong> 60.8 years for the total<br />
population <strong>in</strong> the country (CBS, 2003). Females <strong>in</strong> <strong>Nepal</strong> are slowly show<strong>in</strong>g the tendency <strong>of</strong><br />
liv<strong>in</strong>g longer than males like <strong>in</strong> most other countries.<br />
<strong>Nepal</strong> still has a low level <strong>of</strong> urbanization compared to many other countries <strong>in</strong> Asia. <strong>Nepal</strong>'s<br />
urban centres <strong>in</strong>creased from 16 <strong>in</strong> 1971, 23 <strong>in</strong> 1981, 33 <strong>in</strong> 1991 and 58 <strong>in</strong> 2001. In 2001, <strong>Nepal</strong><br />
had 86.1 per cent rural population and 13.9 per cent urban. With <strong>in</strong>creas<strong>in</strong>g number <strong>of</strong> urban<br />
124