Chapter 15 Internal Migration in Nepal - Central Bureau of Statistics
Chapter 15 Internal Migration in Nepal - Central Bureau of Statistics
Chapter 15 Internal Migration in Nepal - Central Bureau of Statistics

You also want an ePaper? Increase the reach of your titles
YUMPU automatically turns print PDFs into web optimized ePapers that Google loves.
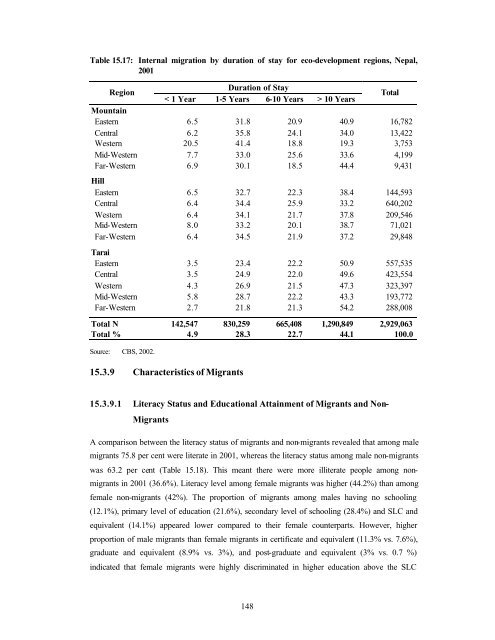
Table <strong>15</strong>.17: <strong>Internal</strong> migration by duration <strong>of</strong> stay for eco-development regions, <strong>Nepal</strong>,<br />
2001<br />
Region<br />
Duration <strong>of</strong> Stay<br />
< 1 Year 1-5 Years 6-10 Years > 10 Years<br />
Total<br />
Mounta<strong>in</strong><br />
Eastern 6.5 31.8 20.9 40.9 16,782<br />
<strong>Central</strong> 6.2 35.8 24.1 34.0 13,422<br />
Western 20.5 41.4 18.8 19.3 3,753<br />
Mid-Western 7.7 33.0 25.6 33.6 4,199<br />
Far-Western 6.9 30.1 18.5 44.4 9,431<br />
Hill<br />
Eastern 6.5 32.7 22.3 38.4 144,593<br />
<strong>Central</strong> 6.4 34.4 25.9 33.2 640,202<br />
Western 6.4 34.1 21.7 37.8 209,546<br />
Mid-Western 8.0 33.2 20.1 38.7 71,021<br />
Far-Western 6.4 34.5 21.9 37.2 29,848<br />
Tarai<br />
Eastern 3.5 23.4 22.2 50.9 557,535<br />
<strong>Central</strong> 3.5 24.9 22.0 49.6 423,554<br />
Western 4.3 26.9 21.5 47.3 323,397<br />
Mid-Western 5.8 28.7 22.2 43.3 193,772<br />
Far-Western 2.7 21.8 21.3 54.2 288,008<br />
Total N 142,547 830,259 665,408 1,290,849 2,929,063<br />
Total % 4.9 28.3 22.7 44.1 100.0<br />
Source: CBS, 2002.<br />
<strong>15</strong>.3.9 Characteristics <strong>of</strong> Migrants<br />
<strong>15</strong>.3.9.1 Literacy Status and Educational Atta<strong>in</strong>ment <strong>of</strong> Migrants and Non-<br />
Migrants<br />
A comparison between the literacy status <strong>of</strong> migrants and non-migrants revealed that among male<br />
migrants 75.8 per cent were literate <strong>in</strong> 2001, whereas the literacy status among male non-migrants<br />
was 63.2 per cent (Table <strong>15</strong>.18). This meant there were more illiterate people among nonmigrants<br />
<strong>in</strong> 2001 (36.6%). Literacy level among female migrants was higher (44.2%) than among<br />
female non-migrants (42%). The proportion <strong>of</strong> migrants among males hav<strong>in</strong>g no school<strong>in</strong>g<br />
(12.1%), primary level <strong>of</strong> education (21.6%), secondary level <strong>of</strong> school<strong>in</strong>g (28.4%) and SLC and<br />
equivalent (14.1%) appeared lower compared to their female counterparts. However, higher<br />
proportion <strong>of</strong> male migrants than female migrants <strong>in</strong> certificate and equivalent (11.3% vs. 7.6%),<br />
graduate and equivalent (8.9% vs. 3%), and post-graduate and equivalent (3% vs. 0.7 %)<br />
<strong>in</strong>dicated that female migrants were highly discrim<strong>in</strong>ated <strong>in</strong> higher education above the SLC<br />
148