Chapter 15 Internal Migration in Nepal - Central Bureau of Statistics
Chapter 15 Internal Migration in Nepal - Central Bureau of Statistics
Chapter 15 Internal Migration in Nepal - Central Bureau of Statistics

Create successful ePaper yourself
Turn your PDF publications into a flip-book with our unique Google optimized e-Paper software.
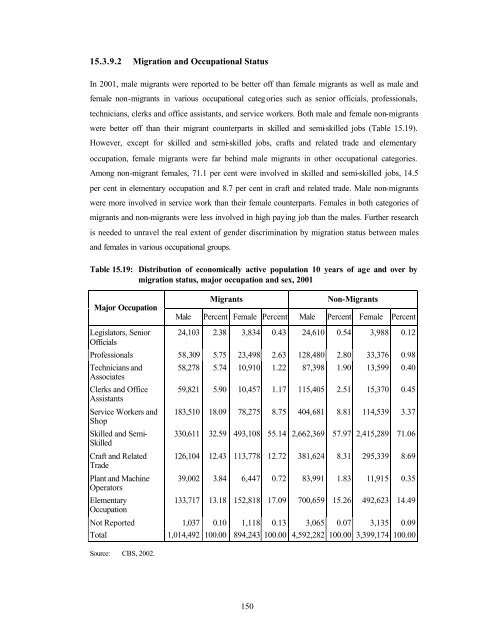
<strong>15</strong>.3.9.2 <strong>Migration</strong> and Occupational Status<br />
In 2001, male migrants were reported to be better <strong>of</strong>f than female migrants as well as male and<br />
female non-migrants <strong>in</strong> various occupational categ ories such as senior <strong>of</strong>ficials, pr<strong>of</strong>essionals,<br />
technicians, clerks and <strong>of</strong>fice assistants, and service workers. Both male and female non-migrants<br />
were better <strong>of</strong>f than their migrant counterparts <strong>in</strong> skilled and semi-skilled jobs (Table <strong>15</strong>.19).<br />
However, except for skilled and semi-skilled jobs, crafts and related trade and elementary<br />
occupation, female migrants were far beh<strong>in</strong>d male migrants <strong>in</strong> other occupational categories.<br />
Among non-migrant females, 71.1 per cent were <strong>in</strong>volved <strong>in</strong> skilled and semi-skilled jobs, 14.5<br />
per cent <strong>in</strong> elementary occupation and 8.7 per cent <strong>in</strong> craft and related trade. Male non-migrants<br />
were more <strong>in</strong>volved <strong>in</strong> service work than their female counterparts. Females <strong>in</strong> both categories <strong>of</strong><br />
migrants and non-migrants were less <strong>in</strong>volved <strong>in</strong> high pay<strong>in</strong>g job than the males. Further research<br />
is needed to unravel the real extent <strong>of</strong> gender discrim<strong>in</strong>ation by migration status between males<br />
and females <strong>in</strong> various occupational groups.<br />
Table <strong>15</strong>.19: Distribution <strong>of</strong> economically active population 10 years <strong>of</strong> age and over by<br />
migration status, major occupation and sex, 2001<br />
Major Occupation<br />
Migrants<br />
Non-Migrants<br />
Male Percent Female Percent Male Percent Female Percent<br />
Legislators, Senior<br />
Officials<br />
24,103 2.38 3,834 0.43 24,610 0.54 3,988 0.12<br />
Pr<strong>of</strong>essionals 58,309 5.75 23,498 2.63 128,480 2.80 33,376 0.98<br />
Technicians and<br />
Associates<br />
Clerks and Office<br />
Assistants<br />
Service Workers and<br />
Shop<br />
Skilled and Semi-<br />
Skilled<br />
Craft and Related<br />
Trade<br />
Plant and Mach<strong>in</strong>e<br />
Operators<br />
Elementary<br />
Occupation<br />
58,278 5.74 10,910 1.22 87,398 1.90 13,599 0.40<br />
59,821 5.90 10,457 1.17 1<strong>15</strong>,405 2.51 <strong>15</strong>,370 0.45<br />
183,510 18.09 78,275 8.75 404,681 8.81 114,539 3.37<br />
330,611 32.59 493,108 55.14 2,662,369 57.97 2,4<strong>15</strong>,289 71.06<br />
126,104 12.43 113,778 12.72 381,624 8.31 295,339 8.69<br />
39,002 3.84 6,447 0.72 83,991 1.83 11,9<strong>15</strong> 0.35<br />
133,717 13.18 <strong>15</strong>2,818 17.09 700,659 <strong>15</strong>.26 492,623 14.49<br />
Not Reported 1,037 0.10 1,118 0.13 3,065 0.07 3,135 0.09<br />
Total 1,014,492 100.00 894,243 100.00 4,592,282 100.00 3,399,174 100.00<br />
Source: CBS, 2002.<br />
<strong>15</strong>0