Chapter 15 Internal Migration in Nepal - Central Bureau of Statistics
Chapter 15 Internal Migration in Nepal - Central Bureau of Statistics
Chapter 15 Internal Migration in Nepal - Central Bureau of Statistics

You also want an ePaper? Increase the reach of your titles
YUMPU automatically turns print PDFs into web optimized ePapers that Google loves.
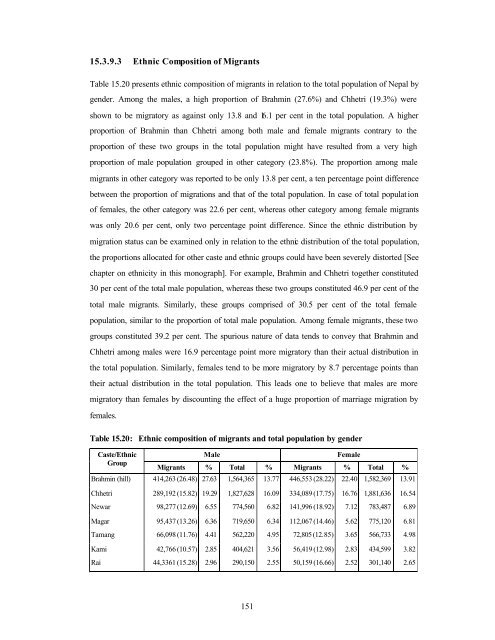
<strong>15</strong>.3.9.3 Ethnic Composition <strong>of</strong> Migrants<br />
Table <strong>15</strong>.20 presents ethnic composition <strong>of</strong> migrants <strong>in</strong> relation to the total population <strong>of</strong> <strong>Nepal</strong> by<br />
gender. Among the males, a high proportion <strong>of</strong> Brahm<strong>in</strong> (27.6%) and Chhetri (19.3%) were<br />
shown to be migratory as aga<strong>in</strong>st only 13.8 and 16.1 per cent <strong>in</strong> the total population. A higher<br />
proportion <strong>of</strong> Brahm<strong>in</strong> than Chhetri among both male and female migrants contrary to the<br />
proportion <strong>of</strong> these two groups <strong>in</strong> the total population might have resulted from a very high<br />
proportion <strong>of</strong> male population grouped <strong>in</strong> other category (23.8%). The proportion among male<br />
migrants <strong>in</strong> other category was reported to be only 13.8 per cent, a ten percentage po<strong>in</strong>t difference<br />
between the proportion <strong>of</strong> migrations and that <strong>of</strong> the total population. In case <strong>of</strong> total populat ion<br />
<strong>of</strong> females, the other category was 22.6 per cent, whereas other category among female migrants<br />
was only 20.6 per cent, only two percentage po<strong>in</strong>t difference. S<strong>in</strong>ce the ethnic distribution by<br />
migration status can be exam<strong>in</strong>ed only <strong>in</strong> relation to the ethnic distribution <strong>of</strong> the total population,<br />
the proportions allocated for other caste and ethnic groups could have been severely distorted [See<br />
chapter on ethnicity <strong>in</strong> this monograph]. For example, Brahm<strong>in</strong> and Chhetri together constituted<br />
30 per cent <strong>of</strong> the total male population, whereas these two groups constituted 46.9 per cent <strong>of</strong> the<br />
total male migrants. Similarly, these groups comprised <strong>of</strong> 30.5 per cent <strong>of</strong> the total female<br />
population, similar to the proportion <strong>of</strong> total male population. Among female migrants, these two<br />
groups constituted 39.2 per cent. The spurious nature <strong>of</strong> data tends to convey that Brahm<strong>in</strong> and<br />
Chhetri among males were 16.9 percentage po<strong>in</strong>t more migratory than their actual distribution <strong>in</strong><br />
the total population. Similarly, females tend to be more migratory by 8.7 percentage po<strong>in</strong>ts than<br />
their actual distribution <strong>in</strong> the total population. This leads one to believe that males are more<br />
migratory than females by discount<strong>in</strong>g the effect <strong>of</strong> a huge proportion <strong>of</strong> marriage migration by<br />
females.<br />
Table <strong>15</strong>.20: Ethnic composition <strong>of</strong> migrants and total population by gender<br />
Caste/Ethnic<br />
Group<br />
Male<br />
Female<br />
Migrants % Total % Migrants % Total %<br />
Brahm<strong>in</strong> (hill) 414,263 (26.48) 27.63 1,564,365 13.77 446,553 (28.22) 22.40 1,582,369 13.91<br />
Chhetri 289,192 (<strong>15</strong>.82) 19.29 1,827,628 16.09 334,089 (17.75) 16.76 1,881,636 16.54<br />
Newar 98,277 (12.69) 6.55 774,560 6.82 141,996 (18.92) 7.12 783,487 6.89<br />
Magar 95,437 (13.26) 6.36 719,650 6.34 112,067 (14.46) 5.62 775,120 6.81<br />
Tamang 66,098 (11.76) 4.41 562,220 4.95 72,805 (12.85) 3.65 566,733 4.98<br />
Kami 42,766 (10.57) 2.85 404,621 3.56 56,419 (12.98) 2.83 434,599 3.82<br />
Rai 44,3361 (<strong>15</strong>.28) 2.96 290,<strong>15</strong>0 2.55 50,<strong>15</strong>9 (16.66) 2.52 301,140 2.65<br />
<strong>15</strong>1