EIF Prospectus - Bright Directions
EIF Prospectus - Bright Directions
EIF Prospectus - Bright Directions

You also want an ePaper? Increase the reach of your titles
YUMPU automatically turns print PDFs into web optimized ePapers that Google loves.
MFS Value Fund<br />
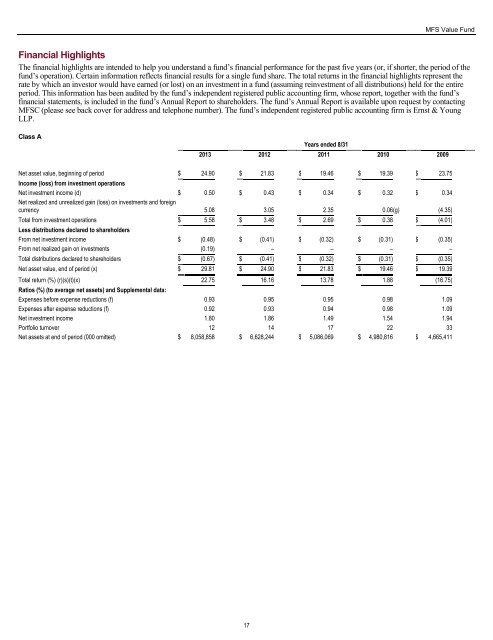
Financial Highlights<br />
The financial highlights are intended to help you understand a fund‟s financial performance for the past five years (or, if shorter, the period of the<br />
fund‟s operation). Certain information reflects financial results for a single fund share. The total returns in the financial highlights represent the<br />
rate by which an investor would have earned (or lost) on an investment in a fund (assuming reinvestment of all distributions) held for the entire<br />
period. This information has been audited by the fund‟s independent registered public accounting firm, whose report, together with the fund‟s<br />
financial statements, is included in the fund‟s Annual Report to shareholders. The fund‟s Annual Report is available upon request by contacting<br />
MFSC (please see back cover for address and telephone number). The fund‟s independent registered public accounting firm is Ernst & Young<br />
LLP.<br />
Class A<br />
Years ended 8/31<br />
2013 2012 2011 2010 2009<br />
Net asset value, beginning of period $ 24.90 $ 21.83 $ 19.46 $ 19.39 $ 23.75<br />
Income (loss) from investment operations<br />
Net investment income (d) $ 0.50 $ 0.43 $ 0.34 $ 0.32 $ 0.34<br />
Net realized and unrealized gain (loss) on investments and foreign<br />
currency 5.08 3.05 2.35 0.06 (g) (4.35)<br />
Total from investment operations $ 5.58 $ 3.48 $ 2.69 $ 0.38 $ (4.01)<br />
Less distributions declared to shareholders<br />
From net investment income $ (0.48) $ (0.41) $ (0.32) $ (0.31) $ (0.35)<br />
From net realized gain on investments (0.19) – – – –<br />
Total distributions declared to shareholders $ (0.67) $ (0.41) $ (0.32) $ (0.31) $ (0.35)<br />
Net asset value, end of period (x) $ 29.81 $ 24.90 $ 21.83 $ 19.46 $ 19.39<br />
Total return (%) (r)(s)(t)(x) 22.75 16.16 13.78 1.88 (16.75)<br />
Ratios (%) (to average net assets) and Supplemental data:<br />
Expenses before expense reductions (f) 0.93 0.95 0.95 0.98 1.09<br />
Expenses after expense reductions (f) 0.92 0.93 0.94 0.98 1.09<br />
Net investment income 1.80 1.86 1.49 1.54 1.94<br />
Portfolio turnover 12 14 17 22 33<br />
Net assets at end of period (000 omitted) $ 8,058,858 $ 6,628,244 $ 5,086,069 $ 4,980,816 $ 4,665,411<br />
17