EIF Prospectus - Bright Directions
EIF Prospectus - Bright Directions
EIF Prospectus - Bright Directions

Create successful ePaper yourself
Turn your PDF publications into a flip-book with our unique Google optimized e-Paper software.
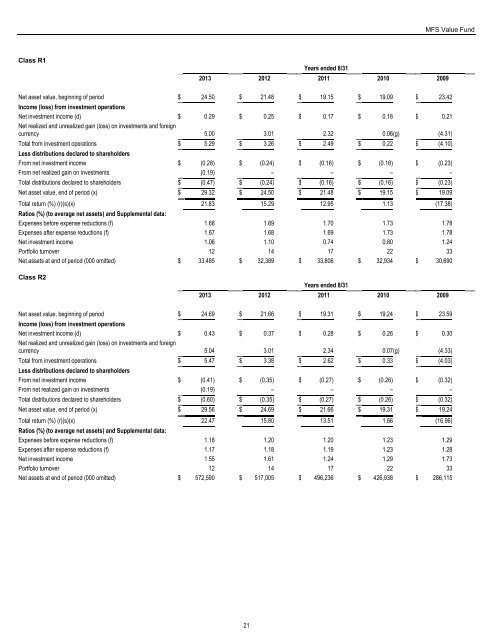
MFS Value Fund<br />
Class R1<br />
Years ended 8/31<br />
2013 2012 2011 2010 2009<br />
Net asset value, beginning of period $ 24.50 $ 21.48 $ 19.15 $ 19.09 $ 23.42<br />
Income (loss) from investment operations<br />
Net investment income (d) $ 0.29 $ 0.25 $ 0.17 $ 0.16 $ 0.21<br />
Net realized and unrealized gain (loss) on investments and foreign<br />
currency 5.00 3.01 2.32 0.06 (g) (4.31)<br />
Total from investment operations $ 5.29 $ 3.26 $ 2.49 $ 0.22 $ (4.10)<br />
Less distributions declared to shareholders<br />
From net investment income $ (0.28) $ (0.24) $ (0.16) $ (0.16) $ (0.23)<br />
From net realized gain on investments (0.19) – – – –<br />
Total distributions declared to shareholders $ (0.47) $ (0.24) $ (0.16) $ (0.16) $ (0.23)<br />
Net asset value, end of period (x) $ 29.32 $ 24.50 $ 21.48 $ 19.15 $ 19.09<br />
Total return (%) (r)(s)(x) 21.83 15.29 12.95 1.13 (17.38)<br />
Ratios (%) (to average net assets) and Supplemental data:<br />
Expenses before expense reductions (f) 1.68 1.69 1.70 1.73 1.78<br />
Expenses after expense reductions (f) 1.67 1.68 1.69 1.73 1.78<br />
Net investment income 1.06 1.10 0.74 0.80 1.24<br />
Portfolio turnover 12 14 17 22 33<br />
Net assets at end of period (000 omitted) $ 33,485 $ 32,389 $ 33,806 $ 32,934 $ 30,690<br />
Class R2<br />
Years ended 8/31<br />
2013 2012 2011 2010 2009<br />
Net asset value, beginning of period $ 24.69 $ 21.66 $ 19.31 $ 19.24 $ 23.59<br />
Income (loss) from investment operations<br />
Net investment income (d) $ 0.43 $ 0.37 $ 0.28 $ 0.26 $ 0.30<br />
Net realized and unrealized gain (loss) on investments and foreign<br />
currency 5.04 3.01 2.34 0.07 (g) (4.33)<br />
Total from investment operations $ 5.47 $ 3.38 $ 2.62 $ 0.33 $ (4.03)<br />
Less distributions declared to shareholders<br />
From net investment income $ (0.41) $ (0.35) $ (0.27) $ (0.26) $ (0.32)<br />
From net realized gain on investments (0.19) – – – –<br />
Total distributions declared to shareholders $ (0.60) $ (0.35) $ (0.27) $ (0.26) $ (0.32)<br />
Net asset value, end of period (x) $ 29.56 $ 24.69 $ 21.66 $ 19.31 $ 19.24<br />
Total return (%) (r)(s)(x) 22.47 15.80 13.51 1.66 (16.96)<br />
Ratios (%) (to average net assets) and Supplemental data:<br />
Expenses before expense reductions (f) 1.18 1.20 1.20 1.23 1.29<br />
Expenses after expense reductions (f) 1.17 1.18 1.19 1.23 1.28<br />
Net investment income 1.55 1.61 1.24 1.29 1.73<br />
Portfolio turnover 12 14 17 22 33<br />
Net assets at end of period (000 omitted) $ 572,590 $ 517,005 $ 496,236 $ 426,938 $ 286,115<br />
21