EIF Prospectus - Bright Directions
EIF Prospectus - Bright Directions
EIF Prospectus - Bright Directions

Create successful ePaper yourself
Turn your PDF publications into a flip-book with our unique Google optimized e-Paper software.
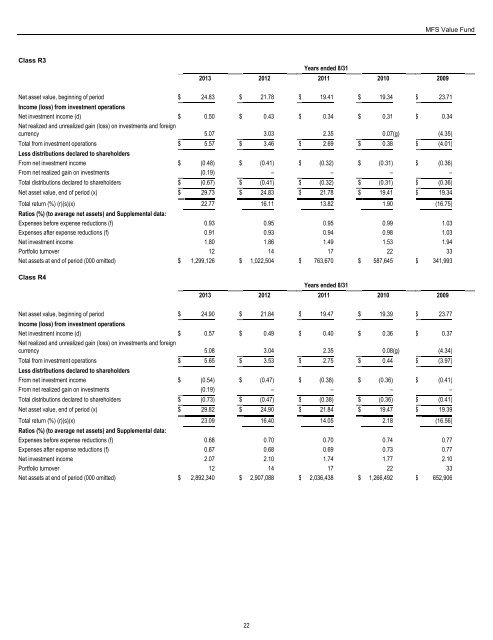
MFS Value Fund<br />
Class R3<br />
Years ended 8/31<br />
2013 2012 2011 2010 2009<br />
Net asset value, beginning of period $ 24.83 $ 21.78 $ 19.41 $ 19.34 $ 23.71<br />
Income (loss) from investment operations<br />
Net investment income (d) $ 0.50 $ 0.43 $ 0.34 $ 0.31 $ 0.34<br />
Net realized and unrealized gain (loss) on investments and foreign<br />
currency 5.07 3.03 2.35 0.07 (g) (4.35)<br />
Total from investment operations $ 5.57 $ 3.46 $ 2.69 $ 0.38 $ (4.01)<br />
Less distributions declared to shareholders<br />
From net investment income $ (0.48) $ (0.41) $ (0.32) $ (0.31) $ (0.36)<br />
From net realized gain on investments (0.19) – – – –<br />
Total distributions declared to shareholders $ (0.67) $ (0.41) $ (0.32) $ (0.31) $ (0.36)<br />
Net asset value, end of period (x) $ 29.73 $ 24.83 $ 21.78 $ 19.41 $ 19.34<br />
Total return (%) (r)(s)(x) 22.77 16.11 13.82 1.90 (16.75)<br />
Ratios (%) (to average net assets) and Supplemental data:<br />
Expenses before expense reductions (f) 0.93 0.95 0.95 0.99 1.03<br />
Expenses after expense reductions (f) 0.91 0.93 0.94 0.98 1.03<br />
Net investment income 1.80 1.86 1.49 1.53 1.94<br />
Portfolio turnover 12 14 17 22 33<br />
Net assets at end of period (000 omitted) $ 1,299,126 $ 1,022,504 $ 763,670 $ 587,645 $ 341,993<br />
Class R4<br />
Years ended 8/31<br />
2013 2012 2011 2010 2009<br />
Net asset value, beginning of period $ 24.90 $ 21.84 $ 19.47 $ 19.39 $ 23.77<br />
Income (loss) from investment operations<br />
Net investment income (d) $ 0.57 $ 0.49 $ 0.40 $ 0.36 $ 0.37<br />
Net realized and unrealized gain (loss) on investments and foreign<br />
currency 5.08 3.04 2.35 0.08 (g) (4.34)<br />
Total from investment operations $ 5.65 $ 3.53 $ 2.75 $ 0.44 $ (3.97)<br />
Less distributions declared to shareholders<br />
From net investment income $ (0.54) $ (0.47) $ (0.38) $ (0.36) $ (0.41)<br />
From net realized gain on investments (0.19) – – – –<br />
Total distributions declared to shareholders $ (0.73) $ (0.47) $ (0.38) $ (0.36) $ (0.41)<br />
Net asset value, end of period (x) $ 29.82 $ 24.90 $ 21.84 $ 19.47 $ 19.39<br />
Total return (%) (r)(s)(x) 23.09 16.40 14.05 2.18 (16.56)<br />
Ratios (%) (to average net assets) and Supplemental data:<br />
Expenses before expense reductions (f) 0.68 0.70 0.70 0.74 0.77<br />
Expenses after expense reductions (f) 0.67 0.68 0.69 0.73 0.77<br />
Net investment income 2.07 2.10 1.74 1.77 2.10<br />
Portfolio turnover 12 14 17 22 33<br />
Net assets at end of period (000 omitted) $ 2,892,340 $ 2,907,088 $ 2,036,438 $ 1,266,492 $ 652,906<br />
22