EIF Prospectus - Bright Directions
EIF Prospectus - Bright Directions
EIF Prospectus - Bright Directions

Create successful ePaper yourself
Turn your PDF publications into a flip-book with our unique Google optimized e-Paper software.
MFS Value Fund<br />
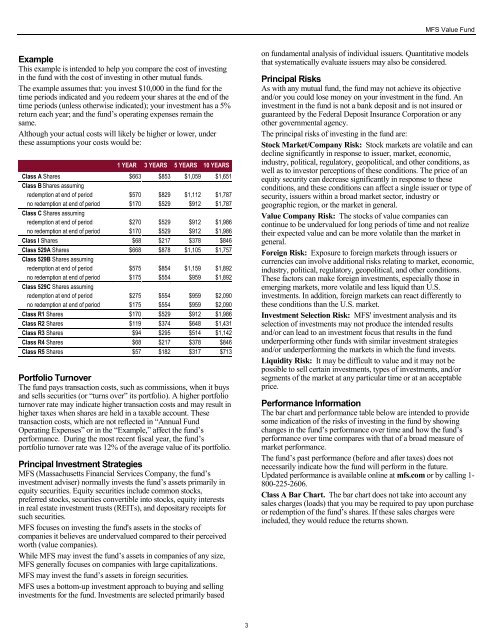
Example<br />
This example is intended to help you compare the cost of investing<br />
in the fund with the cost of investing in other mutual funds.<br />
The example assumes that: you invest $10,000 in the fund for the<br />
time periods indicated and you redeem your shares at the end of the<br />
time periods (unless otherwise indicated); your investment has a 5%<br />
return each year; and the fund‟s operating expenses remain the<br />
same.<br />
Although your actual costs will likely be higher or lower, under<br />
these assumptions your costs would be:<br />
1 YEAR 3 YEARS 5 YEARS 10 YEARS<br />
Class A Shares $663 $853 $1,059 $1,651<br />
Class B Shares assuming<br />
redemption at end of period $570 $829 $1,112 $1,787<br />
no redemption at end of period $170 $529 $912 $1,787<br />
Class C Shares assuming<br />
redemption at end of period $270 $529 $912 $1,986<br />
no redemption at end of period $170 $529 $912 $1,986<br />
Class I Shares $68 $217 $378 $846<br />
Class 529A Shares $668 $878 $1,105 $1,757<br />
Class 529B Shares assuming<br />
redemption at end of period $575 $854 $1,159 $1,892<br />
no redemption at end of period $175 $554 $959 $1,892<br />
Class 529C Shares assuming<br />
redemption at end of period $275 $554 $959 $2,090<br />
no redemption at end of period $175 $554 $959 $2,090<br />
Class R1 Shares $170 $529 $912 $1,986<br />
Class R2 Shares $119 $374 $648 $1,431<br />
Class R3 Shares $94 $295 $514 $1,142<br />
Class R4 Shares $68 $217 $378 $846<br />
Class R5 Shares $57 $182 $317 $713<br />
Portfolio Turnover<br />
The fund pays transaction costs, such as commissions, when it buys<br />
and sells securities (or “turns over” its portfolio). A higher portfolio<br />
turnover rate may indicate higher transaction costs and may result in<br />
higher taxes when shares are held in a taxable account. These<br />
transaction costs, which are not reflected in “Annual Fund<br />
Operating Expenses” or in the “Example,” affect the fund‟s<br />
performance. During the most recent fiscal year, the fund‟s<br />
portfolio turnover rate was 12% of the average value of its portfolio.<br />
Principal Investment Strategies<br />
MFS (Massachusetts Financial Services Company, the fund‟s<br />
investment adviser) normally invests the fund‟s assets primarily in<br />
equity securities. Equity securities include common stocks,<br />
preferred stocks, securities convertible into stocks, equity interests<br />
in real estate investment trusts (REITs), and depositary receipts for<br />
such securities.<br />
MFS focuses on investing the fund's assets in the stocks of<br />
companies it believes are undervalued compared to their perceived<br />
worth (value companies).<br />
While MFS may invest the fund‟s assets in companies of any size,<br />
MFS generally focuses on companies with large capitalizations.<br />
MFS may invest the fund‟s assets in foreign securities.<br />
MFS uses a bottom-up investment approach to buying and selling<br />
investments for the fund. Investments are selected primarily based<br />
on fundamental analysis of individual issuers. Quantitative models<br />
that systematically evaluate issuers may also be considered.<br />
Principal Risks<br />
As with any mutual fund, the fund may not achieve its objective<br />
and/or you could lose money on your investment in the fund. An<br />
investment in the fund is not a bank deposit and is not insured or<br />
guaranteed by the Federal Deposit Insurance Corporation or any<br />
other governmental agency.<br />
The principal risks of investing in the fund are:<br />
Stock Market/Company Risk: Stock markets are volatile and can<br />
decline significantly in response to issuer, market, economic,<br />
industry, political, regulatory, geopolitical, and other conditions, as<br />
well as to investor perceptions of these conditions. The price of an<br />
equity security can decrease significantly in response to these<br />
conditions, and these conditions can affect a single issuer or type of<br />
security, issuers within a broad market sector, industry or<br />
geographic region, or the market in general.<br />
Value Company Risk: The stocks of value companies can<br />
continue to be undervalued for long periods of time and not realize<br />
their expected value and can be more volatile than the market in<br />
general.<br />
Foreign Risk: Exposure to foreign markets through issuers or<br />
currencies can involve additional risks relating to market, economic,<br />
industry, political, regulatory, geopolitical, and other conditions.<br />
These factors can make foreign investments, especially those in<br />
emerging markets, more volatile and less liquid than U.S.<br />
investments. In addition, foreign markets can react differently to<br />
these conditions than the U.S. market.<br />
Investment Selection Risk: MFS' investment analysis and its<br />
selection of investments may not produce the intended results<br />
and/or can lead to an investment focus that results in the fund<br />
underperforming other funds with similar investment strategies<br />
and/or underperforming the markets in which the fund invests.<br />
Liquidity Risk: It may be difficult to value and it may not be<br />
possible to sell certain investments, types of investments, and/or<br />
segments of the market at any particular time or at an acceptable<br />
price.<br />
Performance Information<br />
The bar chart and performance table below are intended to provide<br />
some indication of the risks of investing in the fund by showing<br />
changes in the fund‟s performance over time and how the fund‟s<br />
performance over time compares with that of a broad measure of<br />
market performance.<br />
The fund‟s past performance (before and after taxes) does not<br />
necessarily indicate how the fund will perform in the future.<br />
Updated performance is available online at mfs.com or by calling 1-<br />
800-225-2606.<br />
Class A Bar Chart. The bar chart does not take into account any<br />
sales charges (loads) that you may be required to pay upon purchase<br />
or redemption of the fund‟s shares. If these sales charges were<br />
included, they would reduce the returns shown.<br />
3