EIF Prospectus - Bright Directions
EIF Prospectus - Bright Directions
EIF Prospectus - Bright Directions

Create successful ePaper yourself
Turn your PDF publications into a flip-book with our unique Google optimized e-Paper software.
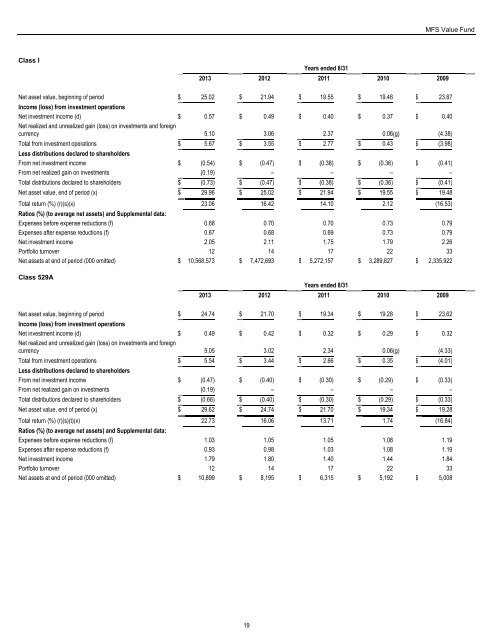
MFS Value Fund<br />
Class I<br />
Years ended 8/31<br />
2013 2012 2011 2010 2009<br />
Net asset value, beginning of period $ 25.02 $ 21.94 $ 19.55 $ 19.48 $ 23.87<br />
Income (loss) from investment operations<br />
Net investment income (d) $ 0.57 $ 0.49 $ 0.40 $ 0.37 $ 0.40<br />
Net realized and unrealized gain (loss) on investments and foreign<br />
currency 5.10 3.06 2.37 0.06 (g) (4.38)<br />
Total from investment operations $ 5.67 $ 3.55 $ 2.77 $ 0.43 $ (3.98)<br />
Less distributions declared to shareholders<br />
From net investment income $ (0.54) $ (0.47) $ (0.38) $ (0.36) $ (0.41)<br />
From net realized gain on investments (0.19) – – – –<br />
Total distributions declared to shareholders $ (0.73) $ (0.47) $ (0.38) $ (0.36) $ (0.41)<br />
Net asset value, end of period (x) $ 29.96 $ 25.02 $ 21.94 $ 19.55 $ 19.48<br />
Total return (%) (r)(s)(x) 23.06 16.42 14.10 2.12 (16.53)<br />
Ratios (%) (to average net assets) and Supplemental data:<br />
Expenses before expense reductions (f) 0.68 0.70 0.70 0.73 0.79<br />
Expenses after expense reductions (f) 0.67 0.68 0.69 0.73 0.79<br />
Net investment income 2.05 2.11 1.75 1.79 2.26<br />
Portfolio turnover 12 14 17 22 33<br />
Net assets at end of period (000 omitted) $ 10,568,573 $ 7,472,693 $ 5,272,157 $ 3,289,827 $ 2,335,922<br />
Class 529A<br />
Years ended 8/31<br />
2013 2012 2011 2010 2009<br />
Net asset value, beginning of period $ 24.74 $ 21.70 $ 19.34 $ 19.28 $ 23.62<br />
Income (loss) from investment operations<br />
Net investment income (d) $ 0.49 $ 0.42 $ 0.32 $ 0.29 $ 0.32<br />
Net realized and unrealized gain (loss) on investments and foreign<br />
currency 5.05 3.02 2.34 0.06 (g) (4.33)<br />
Total from investment operations $ 5.54 $ 3.44 $ 2.66 $ 0.35 $ (4.01)<br />
Less distributions declared to shareholders<br />
From net investment income $ (0.47) $ (0.40) $ (0.30) $ (0.29) $ (0.33)<br />
From net realized gain on investments (0.19) – – – –<br />
Total distributions declared to shareholders $ (0.66) $ (0.40) $ (0.30) $ (0.29) $ (0.33)<br />
Net asset value, end of period (x) $ 29.62 $ 24.74 $ 21.70 $ 19.34 $ 19.28<br />
Total return (%) (r)(s)(t)(x) 22.73 16.06 13.71 1.74 (16.84)<br />
Ratios (%) (to average net assets) and Supplemental data:<br />
Expenses before expense reductions (f) 1.03 1.05 1.05 1.08 1.19<br />
Expenses after expense reductions (f) 0.93 0.98 1.03 1.08 1.19<br />
Net investment income 1.79 1.80 1.40 1.44 1.84<br />
Portfolio turnover 12 14 17 22 33<br />
Net assets at end of period (000 omitted) $ 10,899 $ 8,195 $ 6,315 $ 5,192 $ 5,008<br />
19