EIF Prospectus - Bright Directions
EIF Prospectus - Bright Directions
EIF Prospectus - Bright Directions

You also want an ePaper? Increase the reach of your titles
YUMPU automatically turns print PDFs into web optimized ePapers that Google loves.
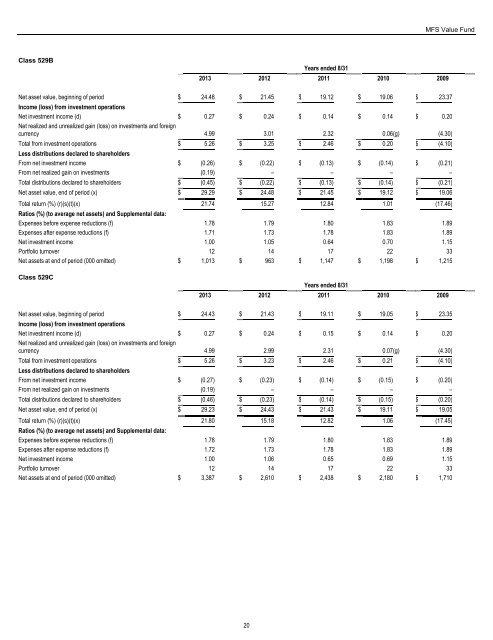
MFS Value Fund<br />
Class 529B<br />
Years ended 8/31<br />
2013 2012 2011 2010 2009<br />
Net asset value, beginning of period $ 24.48 $ 21.45 $ 19.12 $ 19.06 $ 23.37<br />
Income (loss) from investment operations<br />
Net investment income (d) $ 0.27 $ 0.24 $ 0.14 $ 0.14 $ 0.20<br />
Net realized and unrealized gain (loss) on investments and foreign<br />
currency 4.99 3.01 2.32 0.06 (g) (4.30)<br />
Total from investment operations $ 5.26 $ 3.25 $ 2.46 $ 0.20 $ (4.10)<br />
Less distributions declared to shareholders<br />
From net investment income $ (0.26) $ (0.22) $ (0.13) $ (0.14) $ (0.21)<br />
From net realized gain on investments (0.19) – – – –<br />
Total distributions declared to shareholders $ (0.45) $ (0.22) $ (0.13) $ (0.14) $ (0.21)<br />
Net asset value, end of period (x) $ 29.29 $ 24.48 $ 21.45 $ 19.12 $ 19.06<br />
Total return (%) (r)(s)(t)(x) 21.74 15.27 12.84 1.01 (17.46)<br />
Ratios (%) (to average net assets) and Supplemental data:<br />
Expenses before expense reductions (f) 1.78 1.79 1.80 1.83 1.89<br />
Expenses after expense reductions (f) 1.71 1.73 1.78 1.83 1.89<br />
Net investment income 1.00 1.05 0.64 0.70 1.15<br />
Portfolio turnover 12 14 17 22 33<br />
Net assets at end of period (000 omitted) $ 1,013 $ 963 $ 1,147 $ 1,198 $ 1,215<br />
Class 529C<br />
Years ended 8/31<br />
2013 2012 2011 2010 2009<br />
Net asset value, beginning of period $ 24.43 $ 21.43 $ 19.11 $ 19.05 $ 23.35<br />
Income (loss) from investment operations<br />
Net investment income (d) $ 0.27 $ 0.24 $ 0.15 $ 0.14 $ 0.20<br />
Net realized and unrealized gain (loss) on investments and foreign<br />
currency 4.99 2.99 2.31 0.07 (g) (4.30)<br />
Total from investment operations $ 5.26 $ 3.23 $ 2.46 $ 0.21 $ (4.10)<br />
Less distributions declared to shareholders<br />
From net investment income $ (0.27) $ (0.23) $ (0.14) $ (0.15) $ (0.20)<br />
From net realized gain on investments (0.19) – – – –<br />
Total distributions declared to shareholders $ (0.46) $ (0.23) $ (0.14) $ (0.15) $ (0.20)<br />
Net asset value, end of period (x) $ 29.23 $ 24.43 $ 21.43 $ 19.11 $ 19.05<br />
Total return (%) (r)(s)(t)(x) 21.80 15.18 12.82 1.06 (17.45)<br />
Ratios (%) (to average net assets) and Supplemental data:<br />
Expenses before expense reductions (f) 1.78 1.79 1.80 1.83 1.89<br />
Expenses after expense reductions (f) 1.72 1.73 1.78 1.83 1.89<br />
Net investment income 1.00 1.06 0.65 0.69 1.15<br />
Portfolio turnover 12 14 17 22 33<br />
Net assets at end of period (000 omitted) $ 3,387 $ 2,610 $ 2,438 $ 2,180 $ 1,710<br />
20