The value of a parent - Legal & General
The value of a parent - Legal & General
The value of a parent - Legal & General

You also want an ePaper? Increase the reach of your titles
YUMPU automatically turns print PDFs into web optimized ePapers that Google loves.
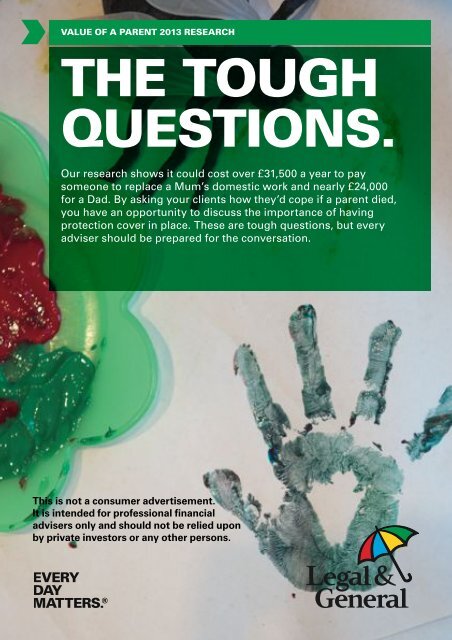
VALUE OF A PARENT 2013 research<br />
the tough<br />
questions.<br />
Our research shows it could cost over £31,500 a year to pay<br />
someone to replace a Mum’s domestic work and nearly £24,000<br />
for a Dad. By asking your clients how they’d cope if a <strong>parent</strong> died,<br />
you have an opportunity to discuss the importance <strong>of</strong> having<br />
protection cover in place. <strong>The</strong>se are tough questions, but every<br />
adviser should be prepared for the conversation.<br />
This is not a consumer advertisement.<br />
It is intended for pr<strong>of</strong>essional financial<br />
advisers only and should not be relied upon<br />
by private investors or any other persons.
contents.<br />
Key findings<br />
INTRODUCTION<br />
VALUE OF A PARENT<br />
THE COST OF RAISING CHILDREN<br />
Parents Lifestyle<br />
financial priorities<br />
GRANDPARENTS<br />
STATE BENEFITS<br />
methodology<br />
3<br />
4<br />
5<br />
9<br />
13<br />
17<br />
25<br />
29<br />
34
key findings – VALUE OF A PARENT 2013 research<br />
3<br />
KEY FINDINGS<br />
• £31,627 – the <strong>value</strong> <strong>of</strong> a Mum per year.<br />
• £23,971 – the <strong>value</strong> <strong>of</strong> a Dad per year. This is 13% higher<br />
than in 2011.<br />
• £23,946 – the <strong>value</strong> <strong>of</strong> the domestic work that the average<br />
full-time working <strong>parent</strong> carries out each year.<br />
• £154,440 – the average day-to-day cost <strong>of</strong> raising a child<br />
to the age <strong>of</strong> 18. This is a 15% increase from 2011.<br />
• Every week, <strong>parent</strong>s are spending, on average,<br />
4.5 hours on social media and 5 hours on researching<br />
products/services online.<br />
• 73% <strong>of</strong> <strong>parent</strong>s said they felt in control <strong>of</strong> their finances.<br />
• 73% <strong>of</strong> <strong>parent</strong>s said their top financial priority was to ensure<br />
their children are looked after if they were unable to due to<br />
death or illness.<br />
• Only 31% <strong>of</strong> <strong>parent</strong>s surveyed have a will.<br />
• Less than a third <strong>of</strong> <strong>parent</strong>s have any Critical Illness<br />
Cover (29%), Income Protection (14%) or Family Income<br />
Benefit (12%).<br />
• Only 29% <strong>of</strong> <strong>parent</strong>s with cover had reviewed it in the last<br />
two years.<br />
• Parents said they spend three times more on pocket money<br />
and treats each week than they do on insurance.<br />
• Expectant Mums underestimated the cost <strong>of</strong> raising<br />
a child by 59%.<br />
• 81% <strong>of</strong> <strong>parent</strong>s thought the government should be<br />
responsible for looking after them if they died, became<br />
critically/terminally ill or were affected by long-term<br />
sickness or disability.<br />
• Grand<strong>parent</strong>s are now the number one back up plan to<br />
maintain a lifestyle if a <strong>parent</strong> died (26%).
4<br />
INTRODUCTION – VALUE OF A PARENT 2013 research<br />
INTRODUCTION.<br />
Welcome to <strong>Legal</strong> & <strong>General</strong>’s Value <strong>of</strong> a Parent 2013 research<br />
report. We’ve been researching the <strong>value</strong> <strong>of</strong> a <strong>parent</strong> for over<br />
30 years, tracking changes in <strong>parent</strong>s’ behaviours and<br />
attitudes towards domestic work.<br />
Parents may tend to take their wages into account when<br />
deciding on a level <strong>of</strong> cover, but they <strong>of</strong>ten don’t consider the<br />
unpaid domestic work they do. If either <strong>parent</strong> were unable<br />
to work or carry out the tasks around the home due to death<br />
or illness, how would they or their partner cope financially?<br />
Would they be able to afford to pay someone to help, or give<br />
up work altogether, to do them? It’s crucial that this is taken<br />
into account.<br />
<strong>The</strong>y don’t expect to be paid for this work, but if they were<br />
how much would it be worth? That’s what this research sets<br />
out to do – to find out the insurance <strong>value</strong> <strong>of</strong> the unpaid work<br />
that a <strong>parent</strong> does around the home.<br />
We believe this research will help you have the more difficult<br />
conversations with your clients in order to help them be more<br />
financially prepared.<br />
OPPORTUNITIES.<br />
Some <strong>of</strong> the areas explored in the research include:<br />
• <strong>The</strong> costs <strong>of</strong> raising children.<br />
• Parents’ lifestyle, including online and social media usage.<br />
• Financial priorities, focusing on how <strong>parent</strong>s prioritise<br />
their finances and whether they’re putting long-term<br />
financial plans in place.<br />
• Grand<strong>parent</strong>s and the role they have in the modern family.<br />
• State benefits and the role <strong>parent</strong>s think they have in<br />
financially supporting their family.
VALUE OF A PARENT – VALUE OF A PARENT 2013 Research<br />
VALUE OF<br />
A PARENT.<br />
5<br />
VALUE OF<br />
A PARENT<br />
When considering levels <strong>of</strong> cover for protection policies, one <strong>of</strong><br />
the biggest considerations is how much people earn. However, in<br />
addition to this, <strong>parent</strong>s carry out unpaid domestic work that <strong>of</strong>ten<br />
isn’t taken into consideration. This section looks at the perception<br />
and reality <strong>of</strong> the <strong>value</strong> <strong>of</strong> this unpaid domestic work.<br />
<strong>value</strong> <strong>of</strong> a <strong>parent</strong><br />
Mum Dad New/expectant<br />
mums<br />
Hours per week 71 hours 53.5 hours 72.5 hours<br />
Cost per year £31,627 £23,971 £32,655<br />
perceived <strong>value</strong> <strong>of</strong> a <strong>parent</strong><br />
perceived<br />
worth<br />
Actual<br />
worth<br />
Difference<br />
Mums £15,548 £31,627 £16,079<br />
Dads £15,496 £23,971 £8,475<br />
Parents are massively underestimating the <strong>value</strong> <strong>of</strong> the unpaid work<br />
they carry out in the home. <strong>The</strong> <strong>value</strong> <strong>of</strong> a Mum’s domestic work is<br />
more than double the estimate, and for Dads there’s a difference <strong>of</strong><br />
55% between the work that <strong>parent</strong>s think they’re carrying out and<br />
the amount they actually are.
6<br />
VALUE OF A PARENT – VALUE OF A PARENT 2013 Research<br />
Value <strong>of</strong> <strong>parent</strong>s by working status<br />
Working status<br />
Cost per year<br />
Full-time £23,946<br />
Part-time £28,833<br />
Not working £34,562<br />
As expected, the average <strong>value</strong> <strong>of</strong> the unpaid domestic work that a<br />
non-working <strong>parent</strong> carries out is highest at £34,562. Interestingly,<br />
<strong>parent</strong>s in full-time employment are contributing just under £24,000<br />
worth <strong>of</strong> unpaid domestic work around the home in addition to their<br />
wages, which is 14% higher than in 2011.<br />
Opportunity<br />
Full-time working <strong>parent</strong>s carry out nearly £24,000 worth <strong>of</strong><br />
unpaid domestic work. Your clients should consider the <strong>value</strong><br />
<strong>of</strong> their domestic work, as well as their wages, when deciding<br />
on a level <strong>of</strong> cover to help ensure they can meet their expenses.
VALUE OF A PARENT – VALUE OF A PARENT 2013 Research<br />
7<br />
Value <strong>of</strong> a <strong>parent</strong> by region<br />
Region Mum Dad<br />
UK £31,627 £23,971<br />
London £32,320 £27,038<br />
South East £33,840 £25,198<br />
South West £27,464 £20,887<br />
East Anglia £29,301 £21,906<br />
West Midlands £30,576 £25,059<br />
East Midlands £29,417 £22,364<br />
North West £30,816 £22,166<br />
North East £32,711 £33,925<br />
Yorkshire/<br />
Humberside<br />
£32,421 £22,465<br />
Scotland £32,289 £22,962<br />
Wales £27,636 £27,344<br />
Northern Ireland £29,384 £21,976<br />
£32,289<br />
£22,962<br />
£29,384<br />
£21,976<br />
£30,816<br />
£22,166<br />
£32,711<br />
£33,925<br />
£32,421<br />
£22,465<br />
KEY<br />
MUM<br />
DAD<br />
£30,576<br />
£25,059<br />
£27,636<br />
£27,344<br />
£27,464<br />
£20,887<br />
£29,417<br />
£22,364<br />
£32,320<br />
£27,038<br />
£29,301<br />
£21,906<br />
£33,840<br />
£25,198
8<br />
VALUE OF A PARENT – VALUE OF A PARENT 2013 Research<br />
<strong>The</strong> highest regional <strong>value</strong>s for Mums in the UK was in the<br />
South East (£33,840), closely followed by the North East (£32,711).<br />
For Dads, the highest regional <strong>value</strong> was in the North East (£33,925),<br />
which is 42% higher than the national average.<br />
Opportunity<br />
<strong>The</strong>se regional figures give a fascinating insight into differences<br />
within the UK. Using these in discussions with clients can help<br />
you bespoke your conversations more towards their specific<br />
protection needs.<br />
“It feels like I’m working<br />
two jobs at once. One<br />
at work where I get paid,<br />
and one at home where<br />
I don’t.”
the cost <strong>of</strong> raising children – VALUE OF A PARENT 2013 Research<br />
9<br />
the cost<br />
<strong>of</strong> raising<br />
children.<br />
Raising a family is an expensive business. This section looks<br />
at the perceived and actual day-to-day costs associated with<br />
looking after a family, and what <strong>parent</strong>s are spending their<br />
money on.<br />
COST OF RAISING<br />
CHILDREN<br />
EXPECTANT MUM’S PERCEPTION OF COST<br />
TO RAISE A CHILD<br />
cost per year<br />
Actual cost £8,580<br />
Expectant Mums’ estimate £5,400<br />
Difference £3,180<br />
<strong>The</strong>re was a £3,180 (or 59%) difference between what expectant<br />
Mums estimated it to cost to raise a child each year and what<br />
it actually costs. Over the course <strong>of</strong> 18 years, this difference<br />
works out at over £57,000.
10<br />
the cost <strong>of</strong> raising children – VALUE OF A PARENT 2013 Research<br />
COST OF RAISING A CHILD PER YEAR<br />
<strong>The</strong> cost <strong>of</strong> raising a child to 18<br />
is £154,440 – Up 15% from 2011.<br />
£10,000<br />
Value<br />
£8,000<br />
£6,000<br />
£5,408<br />
£5,928<br />
£6,864<br />
£7,436<br />
£8,580<br />
£4,000<br />
£2,000<br />
£2,756<br />
0<br />
2001<br />
2004<br />
2005<br />
2009<br />
2011<br />
2013<br />
Spend per year<br />
<strong>The</strong> day-to-day cost <strong>of</strong> raising a child is now £8,580 a year,<br />
which is more than three times higher than when the research<br />
was carried out in 2001.<br />
Opportunity<br />
Our research has found that the average day-to-day cost<br />
<strong>of</strong> raising a child is £8,580 per year. If your client has no<br />
protection cover in place, could they afford these costs<br />
should they or their partner die or be unable to work<br />
due to long term sickness, injury or a critical illness?<br />
Would they have to make cutbacks to their lifestyle?
the cost <strong>of</strong> raising children – VALUE OF A PARENT 2013 Research<br />
11<br />
AVERAGE COST OF RAISING A CHILD<br />
EACH WEEK<br />
£80.00<br />
£70.00<br />
£71.50<br />
All <strong>parent</strong>s average £165<br />
£60.00<br />
£50.00<br />
Cost per week<br />
£40.00<br />
£30.00<br />
£20.00<br />
£10.00<br />
£14.00£14.50<br />
£11.00 £9.00 £11.00<br />
£7.00 £6.50 £4.50 £6.00 £4.50 £5.50<br />
£0.00<br />
Food<br />
Childcare<br />
Clothes<br />
(incl. nappies)<br />
Entertainment<br />
(meals, cinema, etc)<br />
Regular activities<br />
(sports/music)<br />
Pocket money<br />
Dinner money<br />
Anything else<br />
School fees –<br />
private education<br />
Bus or train fares<br />
Treats<br />
Insurance<br />
Cost per household<br />
As expected, the biggest weekly expense is food, which accounts<br />
for 43% <strong>of</strong> the weekly spend.<br />
PRESSURE TO BUY BRANDED GOODS<br />
We also asked the <strong>parent</strong>s in our survey what their attitude is<br />
towards buying branded goods. 32% <strong>of</strong> <strong>parent</strong>s stated that they<br />
felt pressure from their children to buy branded goods. On a<br />
regional level, this was highest in London (41%) and Scotland (40%).<br />
Of those <strong>parent</strong>s that said they felt pressured by their children to<br />
buy branded goods, 75% said that this pressure came from wanting<br />
their children to fit in with their friends.
12<br />
the cost <strong>of</strong> raising children – VALUE OF A PARENT 2013 Research<br />
Opportunity<br />
One <strong>of</strong> the biggest objections that clients have to taking out<br />
cover is that it’s too expensive. But our research suggests that<br />
they’re spending, on average, three times the amount on treats<br />
and pocket money than they are on insurance. Discussing your<br />
client’s short term budgeting and their long term financial plans<br />
and priorities can help challenge these cost objections and<br />
highlight the need for having some protection cover in place.<br />
“I keep my children happy and<br />
healthy, and provide them with<br />
security physically, socially<br />
and financially for today and<br />
in the future.”
Parents Lifestyle – VALUE OF A PARENT 2013 Research<br />
13<br />
<strong>parent</strong>s<br />
lifestyle.<br />
<strong>The</strong> time we spend with our families is incredibly important.<br />
This section will look at how <strong>parent</strong>s are spending their time,<br />
and also the effects <strong>of</strong> new technology and media and how<br />
this is impacting on <strong>parent</strong>s’ behaviour.<br />
PERCEPTION OF TIME SPENT ON<br />
HOUSEHOLD CHORES<br />
Partners’<br />
Perception<br />
Actual<br />
Hours<br />
Difference<br />
Parents<br />
Lifestyle<br />
Mums 20 hours 71 hours 51 hours<br />
Dads 18 hours 53.5 hours 35.5 hours<br />
All <strong>parent</strong>s 19 hours 64.5 hours 45.5 hours<br />
<strong>The</strong> table above shows that there is a big difference between<br />
how much time <strong>parent</strong>s think they’re spending on chores and<br />
how much they’re actually doing. <strong>The</strong>re’s a 51 hour difference<br />
between the perceived amount <strong>of</strong> time Mums spend on<br />
household chores (18 hours) and the amount <strong>of</strong> time Mums<br />
have said they do (71 hours).<br />
Opportunity<br />
Parents are underestimating the amount <strong>of</strong> time that<br />
they and their partner spend carrying out unpaid domestic<br />
work. This could also mean that they’re underestimating<br />
the level <strong>of</strong> cover they may need to protect themselves<br />
in the event that they’re unable to do these tasks.
14<br />
<strong>parent</strong>s lifestyle – VALUE OF A PARENT 2013 Research<br />
BREAKDOWN OF TIME SPENT ON<br />
DOMESTIC CHORES<br />
35<br />
30<br />
30.5<br />
Mum<br />
Dad<br />
25<br />
24<br />
20<br />
Hours<br />
15<br />
10<br />
8.5<br />
5<br />
0<br />
Spending time<br />
with children<br />
Cooking/<br />
preparing meals<br />
6 6.5<br />
Tidying up<br />
4<br />
4.5<br />
Washing/ironing<br />
clothes<br />
3<br />
4.5<br />
2.5<br />
Cleaning/<br />
vacuuming<br />
4<br />
Driving to<br />
activities<br />
3<br />
4<br />
3<br />
3.5 3.5 3.5<br />
Washing up/<br />
dishwasher<br />
Shopping<br />
(instore/online)<br />
Other household<br />
tasks<br />
3<br />
1.5 1.5<br />
Gardening<br />
For both Mums and Dads, childcare is the activity they’re<br />
spending the most time on. <strong>The</strong> <strong>value</strong> <strong>of</strong> childcare a Mum<br />
carries out per week is £277, and for Dads it’s £218.<br />
New Mums are spending the most time on childcare at<br />
33 hours per week, the <strong>value</strong> <strong>of</strong> which is £299.<br />
Opportunity<br />
Mums carry out £277 <strong>of</strong> childcare and Dads £218. Could<br />
your client afford to give up work or pay for childcare?
PARENTS LIFESTYLE – VALUE OF A PARENT 2013 Research 15<br />
TIME <strong>parent</strong>s have TO THEMSELVES AND<br />
WITH PARTNER<br />
hours spent (week)<br />
Time with partner<br />
Time to themselves<br />
17.5 hours<br />
7 hours<br />
Opportunity<br />
Parents spend, on average, 7 hours a week to themselves<br />
and 17.5 hours a week <strong>of</strong> quality time with their partner.<br />
Should the worst happen, would quality time disappear in<br />
favour <strong>of</strong> having to work?<br />
SOCIAL MEDIA AND ONLINE<br />
BEHAVIOUR<br />
TIME SPENT ON SOCIAL MEDIA AND ONLINE<br />
RESEARCHING/SHOPPING per week<br />
overall Mums dads<br />
Time spent shopping<br />
and researching<br />
products/services online<br />
5 hours 5.5 hours 5.5 hours<br />
Time spent on<br />
social media<br />
4.5 hours 5 hours 3.5 hours
16<br />
PARENTs LIFESTYLE – VALUE OF A PARENT 2013 Research<br />
INTERNET USAGE<br />
Smartphone/<br />
iPhone/Blackberry<br />
70%<br />
MUM<br />
DAD<br />
66% 76%<br />
Facebook<br />
63%<br />
66% 56%<br />
Tablet/iPad<br />
Apps for your<br />
bank or other<br />
financial companies<br />
Twitter<br />
Online social<br />
networks for <strong>parent</strong>s<br />
e.g. mumsnet<br />
30%<br />
23%<br />
21%<br />
14%<br />
25% 38%<br />
20% 29%<br />
18% 27%<br />
16% 9%<br />
None <strong>of</strong> the above<br />
0<br />
12%<br />
20<br />
40 60 80 100<br />
Percentage<br />
13% 11%<br />
26% <strong>of</strong> <strong>parent</strong>s also said they use social media to follow companies,<br />
and 25% use it to research products and services <strong>of</strong> interest.<br />
Opportunity<br />
Parents are embracing social media and incorporating it into<br />
their day-to-day lives, with a quarter <strong>of</strong> <strong>parent</strong>s saying they<br />
use it to follow and research companies. Do you have an online<br />
strategy in place? Being active on social media can provide you<br />
with a platform to interact with existing and potential clients<br />
and spread awareness <strong>of</strong> the services you provide.
financial priorities – VALUE OF A PARENT 2013 Research<br />
17<br />
financial<br />
priorities.<br />
We all have financial commitments, and as we all know our<br />
wages only stretch so far. This section <strong>of</strong> the research looks<br />
into the financial priorities <strong>of</strong> <strong>parent</strong>s, starting with the<br />
perceived level <strong>of</strong> control they have over their finances, through<br />
to the financial plans they’ve made and the provisions they<br />
have in place for their family should they not be able to work.<br />
PARENTS THAT FEEL IN CONTROL OF<br />
THEIR FINANCES<br />
KEY<br />
Very in control 21%<br />
Quite in control 52%<br />
Not very in control 20%<br />
Not at all in control 5%<br />
Partner looks after finances 1%<br />
Don’t know 1%<br />
financial<br />
priorities<br />
Encouragingly, the majority <strong>of</strong> <strong>parent</strong>s (73%) we surveyed<br />
said they felt they were in control <strong>of</strong> their finances.<br />
We also asked <strong>parent</strong>s how long they thought their savings<br />
would last if their income stopped. Working <strong>parent</strong>s said they<br />
felt they could last, on average, 7.9 months and non-working<br />
<strong>parent</strong>s said their savings would last 8 months.
18<br />
financial priorities – VALUE OF A PARENT 2013 Research<br />
Opportunity<br />
Despite many <strong>parent</strong>s (73%) feeling in control <strong>of</strong> their finances,<br />
49% didn’t know how long their savings would last if they were<br />
unable to work. Talking to your clients about their day-to-day<br />
spending as well as long term financial planning can help them<br />
regain control <strong>of</strong> their finances.<br />
TOP FINANCIAL PRIORITY<br />
Making sure your child(ren) is/are<br />
financially looked after should you be<br />
unable to (due to death or illness)<br />
73%<br />
Saving enough money to provide for<br />
your child(ren)’s education<br />
23%<br />
Saving enough money to provide for<br />
your child(ren)’s first house<br />
3%<br />
Not surprisingly, nearly three quarters (73%) <strong>of</strong> <strong>parent</strong>s said their<br />
top priority was to ensure that their children are looked after<br />
financially should they be unable to provide for them. <strong>The</strong> findings<br />
were similar for new and expectant Mums, with 72% saying that<br />
this was also their top priority.
financial priorities – VALUE OF A PARENT 2013 Research<br />
19<br />
PLANS IN PLACE<br />
DO YOU HAVE A WILL?<br />
KEY<br />
Yes 31%<br />
No, I haven’t got round to it 52%<br />
No, I don’t feel I need one 16%<br />
Don’t know 1%<br />
Less than a third <strong>of</strong> <strong>parent</strong>s (31%) have a will in place. For new and<br />
expectant mums, this was much lower at 16%.<br />
More worryingly, <strong>of</strong> those <strong>parent</strong>s that don’t have a will, 52% said the<br />
reason they didn’t have one was because they hadn’t got round to it.<br />
Opportunity<br />
52% <strong>of</strong> <strong>parent</strong>s said that the reason they don’t have a will in<br />
place is because they haven’t got round to it, yet 73% said their<br />
top priority was to ensure their children are financially provided<br />
for. This suggests that when talking about being in control <strong>of</strong><br />
their finances, <strong>parent</strong>s are referring more to their day-to-day<br />
finances and less to their long term financial plans.<br />
Unfortunately, although we don’t like to think about it, death<br />
can happen at any time. As well as helping to give clients peace<br />
<strong>of</strong> mind that their money would be left to those that matter<br />
most to them, discussing wills also presents the perfect<br />
opportunity to establish their protection needs.
20<br />
Financial Priorities – VALUE OF A PARENT 2013 Research<br />
INSURANCE PRODUCTS THAT PARENTS<br />
HAVE IN PLACE<br />
mum DAD overall<br />
Life insurance 51% 61% 54%<br />
Critical Illness Cover 27% 34% 29%<br />
Income Protection 13% 16% 14%<br />
Family Income<br />
Benefit<br />
12% 14% 12%<br />
For all types <strong>of</strong> cover, a higher proportion <strong>of</strong> Dads had cover in place<br />
than Mums. Less than a third <strong>of</strong> <strong>parent</strong>s had Critical Illness Cover<br />
(29%), Income Protection (14%) or Family Income Benefit (12%).<br />
Opportunity<br />
<strong>The</strong> proportion <strong>of</strong> <strong>parent</strong>s that had any cover in place was very<br />
low. This is interesting considering that 73% <strong>of</strong> <strong>parent</strong>s said their<br />
top priority was to ensure children are looked after financially<br />
if they were unable to provide for them. This presents a perfect<br />
opportunity to encourage <strong>parent</strong>s to back up their intentions<br />
and actually get cover in place.
financial priorities – VALUE OF A PARENT 2013 Research<br />
21<br />
PARENTS THAT REVIEW THEIR COVER<br />
KEY<br />
Yes 35%<br />
No 59%<br />
Don’t know 6%<br />
Opportunity<br />
Only 35% <strong>of</strong> the <strong>parent</strong>s we surveyed regularly review their<br />
levels <strong>of</strong> protection cover, and only 29% have done so in the<br />
last two years. By not regularly reviewing their cover, clients<br />
may find that the level <strong>of</strong> cover they have in place is no longer<br />
sufficient to help meet their family’s financial needs.
22<br />
financial priorities – VALUE OF A PARENT 2013 Research<br />
COPING FINANCIALLY IF A PARENT BECAME<br />
ILL OR DISABLED<br />
Make cutbacks/reduce spending<br />
52%<br />
Employer covers sickness pay<br />
for a certain period <strong>of</strong> time<br />
Rely on savings<br />
Rely on state benefits<br />
36%<br />
34%<br />
33%<br />
Rely on partner’s wage<br />
26%<br />
Relatives would help<br />
Claim on insurance policy<br />
20%<br />
19%<br />
Partner not working already<br />
6%<br />
Don’t know<br />
11%<br />
0 15 30 45 60<br />
Percentage<br />
Opportunity<br />
33% <strong>of</strong> the <strong>parent</strong>s we surveyed said they’d have to rely on<br />
state benefits if a <strong>parent</strong> became critically ill or disabled.<br />
Would they be able to maintain their lifestyle by relying on<br />
state benefits should the worst happen?
Financial Priorities – VALUE OF A PARENT 2013 Research 23<br />
MAINTAINING LIFESTYLE iF PARENT DIED<br />
Parents<br />
Rely on grand<strong>parent</strong>s to<br />
look after children<br />
Would work part time<br />
to look after family<br />
Children old enough to<br />
look after each other<br />
Rely on family while at work<br />
26%<br />
23%<br />
21%<br />
18%<br />
MUM DAD<br />
28% 23%<br />
21% 27%<br />
23% 18%<br />
20% 15%<br />
Downsize home<br />
Continue to be full time<br />
house wife/husband<br />
Give up work to<br />
look after family<br />
Employ a childminder<br />
while out at work<br />
Move in with family<br />
Rely on friends while<br />
out at work<br />
Another alternative<br />
Employ a live-in<br />
nanny/aupair<br />
Don’t know<br />
Nothing<br />
7%<br />
6%<br />
3%<br />
2%<br />
5%<br />
11%<br />
11%<br />
10%<br />
9%<br />
12%<br />
0 5 10 15 20 25 30<br />
Percentage<br />
7% 18%<br />
8% 16%<br />
10% 11%<br />
10% 9%<br />
6% 10%<br />
6% 7%<br />
4% 3%<br />
2% 1%<br />
13% 12%<br />
4% 7%<br />
Getting help from their children’s grand<strong>parent</strong>s is the most common<br />
back up plan <strong>parent</strong>s have in place to maintain their lifestyle should<br />
a <strong>parent</strong> die (26%). 17% <strong>of</strong> <strong>parent</strong>s said that they had no plans or<br />
didn’t know what they would do if either they or their partner died.
24<br />
financial priorities – VALUE OF A PARENT 2013 Research<br />
Opportunity<br />
10% <strong>of</strong> <strong>parent</strong>s said that if their partner were to die, they<br />
would give up work to look after the family. Without having<br />
protection in place, these <strong>parent</strong>s may have to rely on state<br />
benefits. How would your clients cope financially if they had<br />
to rely on state benefits? Would these be enough to maintain<br />
their current lifestyle?<br />
Also 26% <strong>of</strong> <strong>parent</strong>s said that they would rely on their children’s<br />
grand<strong>parent</strong>s to look after their children if they died. But is this<br />
a reliable long-term solution?<br />
“I want to be able to provide<br />
for my family, both now and<br />
if something happened to me.”
grand<strong>parent</strong>s – VALUE OF A PARENT 2013 Research<br />
25<br />
grand<strong>parent</strong>s.<br />
With the increased cost <strong>of</strong> living in recent years, some <strong>parent</strong>s<br />
are finding themselves having to return to work to meet their<br />
family’s financial needs.<br />
Grand<strong>parent</strong>s are playing an increasingly important role in the<br />
family, from providing financial support to helping with childcare<br />
and looking after the home. In fact, as indicated in the financial<br />
priorities section, relying on grand<strong>parent</strong>s is the most common<br />
back up plan <strong>parent</strong>s have in place to help maintain a family’s<br />
lifestyle should a <strong>parent</strong> die, showing just how crucial they’ve<br />
become to modern family life.<br />
THE VALUE OF GRANDPARENTS<br />
full-time<br />
working<br />
<strong>parent</strong>s<br />
part-time<br />
working<br />
<strong>parent</strong>s<br />
% Who have help<br />
with childcare<br />
whilst at work<br />
26% 23%<br />
Average hours<br />
per week<br />
grand<strong>parent</strong>s work<br />
% That pay<br />
grand<strong>parent</strong>s<br />
for help<br />
8 hours 8 hours<br />
26% 20%<br />
Grand<strong>parent</strong>s<br />
Although grand<strong>parent</strong>s are helping an average <strong>of</strong> 8 hours a week,<br />
only 26% <strong>of</strong> the full-time working <strong>parent</strong>s and 20% <strong>of</strong> part-time<br />
working <strong>parent</strong>s we surveyed pay for this help. If <strong>parent</strong>s<br />
were paying for childcare instead <strong>of</strong> having unpaid help from<br />
grand<strong>parent</strong>s, this would cost an average <strong>of</strong> £73 per week.
26<br />
grand<strong>parent</strong>s – VALUE OF A PARENT 2013 Research<br />
TOP REASONS FOR USING GRANDPARENTS<br />
FOR CHILDCARE<br />
Strongly agree<br />
Strongly disagree<br />
Tend to agree<br />
Don’t know<br />
Tend to disagree<br />
I am grateful to my childrens<br />
grand<strong>parent</strong>s for helping with childcare<br />
68% 29%<br />
2%<br />
1%<br />
<strong>The</strong> children’s grand<strong>parent</strong>s are the best people<br />
to look after them while I am at work<br />
50%<br />
43%<br />
5%<br />
2%<br />
I can only work the hours that I do because my<br />
children’s grand<strong>parent</strong>s can <strong>of</strong>fer flexible childcare<br />
36% 30% 18% 3%<br />
13%<br />
I can only afford to work because my children’s<br />
grand<strong>parent</strong>s help with the childcare<br />
30% 29% 29%<br />
7%<br />
5%<br />
0 20 40 60 80 100<br />
Percentage<br />
93% <strong>of</strong> <strong>parent</strong>s agreed that their children’s grand<strong>parent</strong>s were the<br />
best people to provide childcare whilst they’re at work. New and<br />
expectant Mums agreed with this sentiment, with 66% <strong>of</strong> them<br />
choosing to use their own or their spouse’s <strong>parent</strong>s as childcare,<br />
stating that the top reason for this is that they trust them (69%).<br />
Interestingly, the <strong>parent</strong>s we surveyed indicated that the flexibility<br />
<strong>of</strong> childcare (66%) their children’s grand<strong>parent</strong>s can <strong>of</strong>fer is a more<br />
important factor than cost (59%).
grand<strong>parent</strong>s – VALUE OF A PARENT 2013 Research 27<br />
IF GRANDPARENT COULD NO LONGER HELP<br />
WITH CHILDCARE WHILST A PARENT IS AT WORK<br />
Organise alternative<br />
paid childcare<br />
36%<br />
Change working hours<br />
36%<br />
Organise other family or<br />
friends to cover childcare<br />
24%<br />
Stop working as it would<br />
not be financially worthwhile<br />
to pay for childcare<br />
21%<br />
Change jobs<br />
19%<br />
Stop working because<br />
I only want my family to<br />
look after my children<br />
9%<br />
0 10 20 30 40<br />
Percentage<br />
<strong>The</strong>re are some big differences between this year’s findings and<br />
those from our 2011 survey. Most notably, the number <strong>of</strong> <strong>parent</strong>s<br />
who’d stop working if their children’s grand<strong>parent</strong>s couldn’t provide<br />
childcare is down 10% from 2011. <strong>The</strong> number <strong>of</strong> <strong>parent</strong>s who<br />
indicated they’d change their working hours in favour <strong>of</strong> quitting<br />
work has increased, from 29% in 2011 to 36% in 2013.
28<br />
GRANDPARENTS – VALUE OF A PARENT 2013 Research<br />
Opportunity<br />
Our findings suggest that grand<strong>parent</strong>s are a trusted and<br />
flexible source <strong>of</strong> childcare, and the average <strong>value</strong> <strong>of</strong> this is<br />
£73 per week.<br />
Do any <strong>of</strong> your clients indicate that they regularly rely on<br />
grand<strong>parent</strong>s for help with childcare or would they use them<br />
as a back up plan? Ask them how they’d cope if this care was<br />
no longer available. Would they be able to afford to pay a<br />
child-minder? Or would they be able to afford to give up<br />
work in favour <strong>of</strong> looking after their children?
STATE BENEFITS – VALUE OF A PARENT 2013 Research<br />
29<br />
STATE<br />
BENEFITS.<br />
Many people think that if they or their partner died or were<br />
unable to work, the help they would get from the state would<br />
be enough to look after themselves financially. However, with<br />
a difficult economic climate and austerity measures being<br />
introduced, these benefits are being eroded. This section<br />
looks at <strong>parent</strong>s’ attitudes towards state benefits.<br />
RESPONSIBILITY FOR HELPING<br />
FINANCIALLY IF A PARENT DIED, BECAME<br />
CRITICALLY/TERMINALLY ILL OR WERE<br />
AFFECTED BY LONG TERM SICKNESS<br />
OR DISABILITY<br />
90<br />
80<br />
70<br />
81%<br />
Percentage<br />
60<br />
50<br />
40<br />
30<br />
20<br />
10<br />
0<br />
32%<br />
15%<br />
10%<br />
Government Should be insured Friends/Family Charities<br />
State benefits
30<br />
STATE BENEFITS – VALUE OF A PARENT 2013 Research<br />
<strong>The</strong>re is a big difference in <strong>parent</strong>s’ perceptions in this year’s<br />
survey than in 2011. This year, 81% <strong>of</strong> <strong>parent</strong>s said that they think<br />
the government should be responsible for looking after them<br />
financially if they or their partner died or were unable to work due<br />
to a critical/terminal illness or long-term sickness. When asked<br />
in 2011, 59% <strong>of</strong> <strong>parent</strong>s thought the government should be<br />
responsible for helping financially if they died and 63% if they<br />
became critically ill.<br />
More worryingly, only 32% <strong>of</strong> <strong>parent</strong>s suggested that they should<br />
have some form <strong>of</strong> protection cover in place. This is interesting,<br />
considering that 73% <strong>of</strong> the <strong>parent</strong>s we surveyed stated that they<br />
felt in control <strong>of</strong> their finances. This suggests that although some<br />
<strong>parent</strong>s believe they are in financial control when it comes to short<br />
term budgeting, many aren’t taking responsibility and putting<br />
longer term financial plans in place.<br />
“<strong>The</strong> government and society<br />
have made it so hard for<br />
Mothers. I feel I’ve been<br />
given an ultimatum; look<br />
after your children and<br />
have little money or work<br />
and miss your child’s life.”
STATE BENEFITS – VALUE OF A PARENT 2013 Research 31<br />
STATE BENEFITS PARENTS BELIEVE THEY’D<br />
BE ENTITLED TO IF EITHER PARENT DIED<br />
Widowed <strong>parent</strong>s allowance<br />
26%<br />
Council tax benefit<br />
Housing benefit/Universal credit<br />
Working families tax credit/<br />
Universal credit<br />
New deal for lone <strong>parent</strong>s<br />
Income support/Universal credit<br />
Unemployment and support<br />
allowance/Incapacity benefit<br />
Disability living allowance/<br />
Personal independence payments<br />
Disabled persons tax credit<br />
Jobseeker’s allowance/<br />
Universal credit<br />
Don’t know<br />
3%<br />
3%<br />
2%<br />
2%<br />
8%<br />
8%<br />
8%<br />
7%<br />
13%<br />
59%<br />
0 10 20 30 40 50 60 70<br />
Percentage
32<br />
STATE BENEFITS – VALUE OF A PARENT 2013 Research<br />
STATE BENEFITS PARENTS BELIEVE THEY’D<br />
BE ENTITLED TO IF EITHER PARENT WERE<br />
TO BECOME DISABLED<br />
Disability living allowance/<br />
Personal independence payments<br />
55%<br />
Disabled person tax credit<br />
40%<br />
Council tax benefit<br />
Housing benefit/Universal credit<br />
Employment and support allowance<br />
(incapacity benefit)<br />
23%<br />
21%<br />
26%<br />
Income support/Universal credit<br />
Working families tax credit/<br />
Universal credit<br />
Jobseeker’s allowance/<br />
Universal credit<br />
New deal for lone <strong>parent</strong>s<br />
Widowed <strong>parent</strong>s allowance<br />
12%<br />
7%<br />
3%<br />
2%<br />
1%<br />
Don’t know<br />
32%<br />
0 10 20 30 40 50 60 70 80<br />
Percentage<br />
Although the majority <strong>of</strong> <strong>parent</strong>s thought that it’s the government’s<br />
responsibility to look after them if they were unable to work, 59% <strong>of</strong><br />
<strong>parent</strong>s don’t know what benefits they’d be entitled to if either <strong>parent</strong><br />
died and 32% if either <strong>parent</strong> is unable to work due to disability.
STATE BENEFITS – VALUE OF A PARENT 2013 Research<br />
33<br />
Opportunity<br />
Our research shows that although the majority <strong>of</strong> <strong>parent</strong>s think<br />
the government should be responsible for looking after them<br />
financially (81%), a high proportion <strong>of</strong> <strong>parent</strong>s don’t know what<br />
benefits they’d be entitled to.<br />
If your client says they’re concerned about the level <strong>of</strong> financial<br />
support they would receive from the government if their partner<br />
died or they couldn’t work, having some financial protection in<br />
place could help to ease these concerns.<br />
WHERE PARENTS GO WHEN THEY NEED<br />
FINANCIAL ADVICE<br />
We asked <strong>parent</strong>s where they would go for information if they<br />
needed financial advice. <strong>The</strong> most popular response was Citizen’s<br />
Advice Bureau (34%). <strong>The</strong> next highest response was that they<br />
didn’t know where they’d go for financial help (19%).<br />
Opportunity<br />
This shows the importance <strong>of</strong> the advice that you have to <strong>of</strong>fer.<br />
By promoting the services you can <strong>of</strong>fer and giving advice on<br />
protection cover, you’ll be able to give those people who are<br />
unsure where to go an outlet to get sound financial advice.
34 methodology – VALUE OF A PARENT 2013 Research<br />
methodology.<br />
Audience<br />
• Main Value <strong>of</strong> a Parent survey <strong>of</strong> <strong>parent</strong>s with at least one child<br />
aged 18 or under living with them.<br />
• New additional survey <strong>of</strong> expectant Mums or Mums with<br />
a child under 1 year old.<br />
Quotas<br />
• Quotas were set to ensure the balance <strong>of</strong> the sample reflected<br />
the sample in the 2011 and 2009 surveys in terms <strong>of</strong> gender,<br />
work status and marital status.<br />
Method<br />
• Fieldwork was conducted from 18th to 25th January 2013.<br />
• Online survey with sample from a panel.<br />
• This audience is likely to have higher than average use <strong>of</strong> the<br />
internet as the respondents have participated in an online survey.<br />
Questionnaire<br />
• Bespoke questionnaire designed for this project.<br />
• <strong>The</strong> core <strong>value</strong> <strong>of</strong> <strong>parent</strong> questions remain the same for<br />
tracking purposes, with the addition <strong>of</strong> new questions to create<br />
fresh insights.
Please speak to your usual<br />
<strong>Legal</strong> & <strong>General</strong> contact.<br />
<strong>Legal</strong> & <strong>General</strong> Partnership Services Limited<br />
Registered in England and Wales No. 05045000<br />
Authorised and regulated by the Financial Conduct Authority.<br />
<strong>Legal</strong> & <strong>General</strong> Assurance Society Limited<br />
Registered in England and Wales No. 00166055<br />
Authorised by the Prudential Regulation Authority and<br />
regulated by the Financial Conduct Authority and the<br />
Prudential Regulation Authority.<br />
We are members <strong>of</strong> the Association <strong>of</strong> British Insurers.<br />
Registered <strong>of</strong>fice for both firms: One Coleman Street,<br />
London EC2R 5AA<br />
W13408 10/13