

ETH ZURICH - ETH - Finanzen und Controlling
ETH ZURICH - ETH - Finanzen und Controlling
ETH ZURICH - ETH - Finanzen und Controlling

Create successful ePaper yourself
Turn your PDF publications into a flip-book with our unique Google optimized e-Paper software.
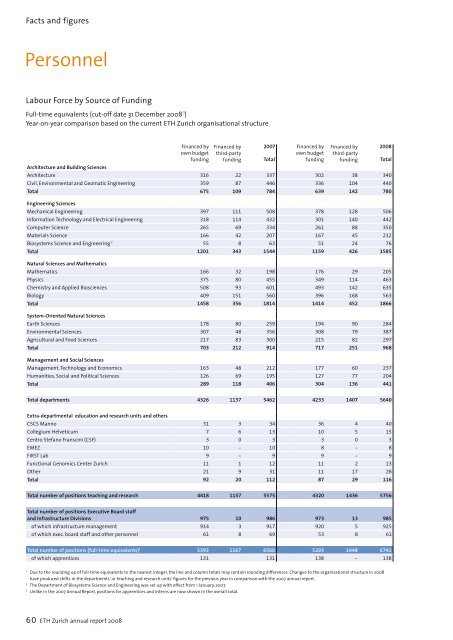
Facts and figures<br />
Personnel<br />
Labour Force by Source of F<strong>und</strong>ing<br />
Full-time equivalents (cut-off date 31 December 2008 1 )<br />
Year-on-year comparison based on the current <strong>ETH</strong> Zurich organisational structure<br />
Financed by<br />
own budget<br />
f<strong>und</strong>ing<br />
Financed by<br />
third-party<br />
f<strong>und</strong>ing<br />
2007 Financed by<br />
own budget<br />
Total<br />
f<strong>und</strong>ing<br />
Financed by<br />
third-party<br />
f<strong>und</strong>ing<br />
Architecture and Building Sciences<br />
Architecture 316 22 337 302 38 340<br />
Civil, Environmental and Geomatic Engineering 359 87 446 336 104 440<br />
Total 675 109 784 639 142 780<br />
Engineering Sciences<br />
Mechanical Engineering 397 111 508 378 128 506<br />
Information Technology and Electrical Engineering 318 114 432 301 140 442<br />
Computer Science 265 69 334 261 88 350<br />
Materials Science 166 42 207 167 45 212<br />
Biosystems Science and Engineering 2 55 8 63 51 24 76<br />
Total 1201 343 1544 1159 426 1585<br />
Natural Sciences and Mathematics<br />
Mathematics 166 32 198 176 29 205<br />
Physics 375 80 455 349 114 463<br />
Chemistry and Applied Biosciences 508 93 601 493 142 635<br />
Biology 409 151 560 396 168 563<br />
Total 1458 356 1814 1414 452 1866<br />
System-Oriented Natural Sciences<br />
Earth Sciences 178 80 259 194 90 284<br />
Environmental Sciences 307 48 356 308 79 387<br />
Agricultural and Food Sciences 217 83 300 215 82 297<br />
Total 703 212 914 717 251 968<br />
Management and Social Sciences<br />
Management, Technology and Economics 163 48 212 177 60 237<br />
Humanities, Social and Political Sciences 126 69 195 127 77 204<br />
Total 289 118 406 304 136 441<br />
2008<br />
Total<br />
Total departments 4326 1137 5462 4233 1407 5640<br />
Extra-departmental education and research units and others<br />
CSCS Manno 31 3 34 36 4 40<br />
Collegium Helveticum 7 6 13 10 5 15<br />
Centro Stefano Franscini (CSF) 3 0 3 3 0 3<br />
EMEZ 10 - 10 8 - 8<br />
FIRST Lab 9 - 9 9 - 9<br />
Functional Genomics Center Zurich 11 1 12 11 2 13<br />
Other 21 9 31 11 17 28<br />
Total 92 20 112 87 29 116<br />
Total number of positions teaching and research 4418 1157 5575 4320 1436 5756<br />
Total number of positions Executive Board staff<br />
and Infrastructure Divisions 975 10 986 973 13 985<br />
of which infrastructure management 914 3 917 920 5 925<br />
of which exec. board staff and other personnel 61 8 69 53 8 61<br />
Total number of positions (full-time equivalents) 3 5393 1167 6560 5293 1448 6741<br />
of which apprentices 131 131 138 - 138<br />
1<br />
Due to the ro<strong>und</strong>ing up of full-time equivalents to the nearest integer, the line and column totals may contain ro<strong>und</strong>ing differences. Changes to the organisational structure in 2008<br />
have produced shifts in the departments’ or teaching and research units’ figures for the previous year in comparison with the 2007 annual report.<br />
2<br />
The Department of Biosystems Science and Engineering was set up with effect from 1 January, 2007.<br />
3<br />
Unlike in the 2007 Annual Report, positions for apprentices and interns are now shown in the overall total.<br />
60 <strong>ETH</strong> Zurich annual report 2008


![DFC Newsletter Ausgabe 2006/09 September [Deutsch] (PDF, 103 kB)](https://img.yumpu.com/38538463/1/184x260/dfc-newsletter-ausgabe-2006-09-september-deutsch-pdf-103-kb.jpg?quality=85)