editorial team
editorial team
editorial team

Create successful ePaper yourself
Turn your PDF publications into a flip-book with our unique Google optimized e-Paper software.
for the whole period, Malatya city is the hottest area for<br />
the whole period. The monthly average temperatures<br />
showed changing between -9.4 and 19.4°C for Erzurum<br />
city, 1.6 and 27.9°C for Malatya city.<br />
The simple function of the monthly average<br />
temperature (AT 1 ) fit the ambient temperature data very<br />
well. The results of statistical analyses undertaken on<br />
trigonometric model for the monthly average<br />
temperature are given in Table 3. The model was<br />
evaluated based on R, χ 2 and RMSE. Generally, R, χ 2<br />
and RMSE values were varied between 0.99660–<br />
0.99920, 0.226–0.979 and 0.395–0.823, respectively.<br />
The function has coefficients of determination of better<br />
than 0.99 and the lowest values of χ 2 and RMSE for all<br />
cities. Hence, the trigonometric model (AT 1 )<br />
satisfactorily described characteristics of the monthly<br />
average temperature. Considering trigonometric model<br />
(AT 1 ), the observed monthly average temperature<br />
values were compared with calculated ones. Figure 3<br />
shows the predicted and observed values of monthly<br />
average temperature. As seen from Fig. 3, there is a<br />
good agreement between predicted and observed values.<br />
Table 2. Models for the weather data<br />
Monthly average<br />
AT1 = a+b·sin(m)+c·sin((m/2)+d)<br />
temperature<br />
Monthly average<br />
AT2 = a+b·sin(m)+c·sin((m/2)+d)<br />
maximum temperature<br />
Monthly average<br />
AT3 = a+b·sin(m)+c·sin((m/2)+d)<br />
minimum temperature<br />
Monthly average<br />
RH = a+b·sin(m)+c·sin((m/2)+d)<br />
relative humidity<br />
Monthly average WS = a+b·m+c· (m²)+<br />
wind speed<br />
d·(m 3 )+e·(m 4 )<br />
Monthly average P = a+b·m+c· (m²)+<br />
pressure<br />
d·(m 3 )+e·(m 4 )<br />
Monthly average RF = a+b·m+c· (m²)+<br />
rainfall<br />
d·(m 3 )+e·(m 4 )<br />
Monthly average<br />
SR = a+b·sin(m)+c·sin((m/2)+d)<br />
solar radiation<br />
Monthly average SD = a +b·sin(m)+c·sin(2·m)+<br />
sunshine duration d·sin(m/2+e) +f·m<br />
Akpinar and Akpinar<br />
Predicted valu<br />
30<br />
25<br />
20<br />
15<br />
10<br />
5<br />
0<br />
-15 -10 -5<br />
-5<br />
0 5 10 15 20 25 30<br />
-10<br />
-15<br />
Observed values<br />
Elazig<br />
12<br />
Erzincan<br />
Erzurum<br />
Kars<br />
Agri<br />
Igdir<br />
Tunceli<br />
Van<br />
Malatya<br />
Bingöl<br />
Muş<br />
Bitlis<br />
Hakkari<br />
Fig. 3 Observed and predicted values of the monthly average<br />
temperatures.<br />
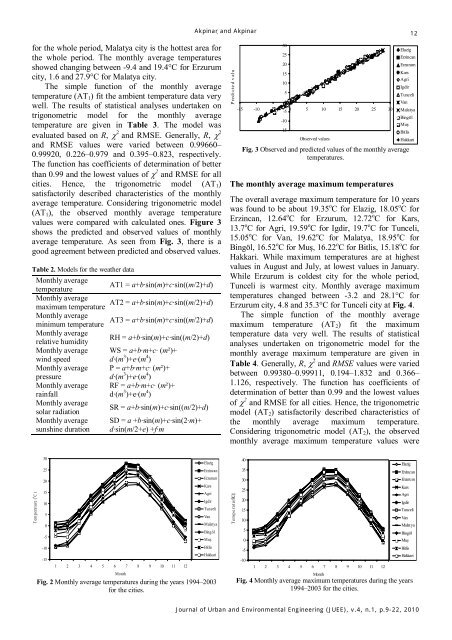
The monthly average maximum temperatures<br />
The overall average maximum temperature for 10 years<br />
was found to be about 19.35 o C for Elazig, 18.05 o C for<br />
Erzincan, 12.64 o C for Erzurum, 12.72 o C for Kars,<br />
13.7 o C for Agri, 19.59 o C for Igdir, 19.7 o C for Tunceli,<br />
15.05 o C for Van, 19.62 o C for Malatya, 18.95 o C for<br />
Bingöl, 16.52 o C for Muş, 16.22 o C for Bitlis, 15.18 o C for<br />
Hakkari. While maximum temperatures are at highest<br />
values in August and July, at lowest values in January.<br />
While Erzurum is coldest city for the whole period,<br />
Tunceli is warmest city. Monthly average maximum<br />
temperatures changed between -3.2 and 28.1°C for<br />
Erzurum city, 4.8 and 35.3°C for Tunceli city at Fig. 4.<br />
The simple function of the monthly average<br />
maximum temperature (AT 2 ) fit the maximum<br />
temperature data very well. The results of statistical<br />
analyses undertaken on trigonometric model for the<br />
monthly average maximum temperature are given in<br />
Table 4. Generally, R, χ 2 and RMSE values were varied<br />
between 0.99380–0.99911, 0.194–1.832 and 0.366–<br />
1.126, respectively. The function has coefficients of<br />
determination of better than 0.99 and the lowest values<br />
of χ 2 and RMSE for all cities. Hence, the trigonometric<br />
model (AT 2 ) satisfactorily described characteristics of<br />
the monthly average maximum temperature.<br />
Considering trigonometric model (AT 2 ), the observed<br />
monthly average maximum temperature values were<br />
Temperature ( o C)<br />
30<br />
25<br />
20<br />
15<br />
10<br />
5<br />
0<br />
-5<br />
-10<br />
-15<br />
1 2 3 4 5 6 7 8 9 10 11 12<br />
Month<br />
Elazig<br />
Erzincan<br />
Erzurum<br />
Kars<br />
Agri<br />
Igdir<br />
Tunceli<br />
Van<br />
Malatya<br />
Bingöl<br />
Muş<br />
Bitlis<br />
Hakkari<br />
Fig. 2 Monthly average temperatures during the years 1994–2003<br />
for the cities.<br />
o<br />
Temperature C ( )<br />
40<br />
35<br />
30<br />
25<br />
20<br />
15<br />
10<br />
5<br />
0<br />
-5<br />
-10<br />
1 2 3 4 5 6 7 8 9 10 11 12<br />
Month<br />
Elazig<br />
Erzinc an<br />
Erzurum<br />
Kars<br />
Agri<br />
Igdir<br />
Tunceli<br />
Van<br />
Malatya<br />
Bingöl<br />
Muş<br />
Bitlis<br />
Hakkari<br />
Fig. 4 Monthly average maximum temperatures during the years<br />
1994–2003 for the cities.<br />
Journal of Urban and Environmental Engineering (JUEE), v.4, n.1, p.9-22, 2010