editorial team
editorial team
editorial team

Create successful ePaper yourself
Turn your PDF publications into a flip-book with our unique Google optimized e-Paper software.
Martínez and Poleto<br />
5<br />
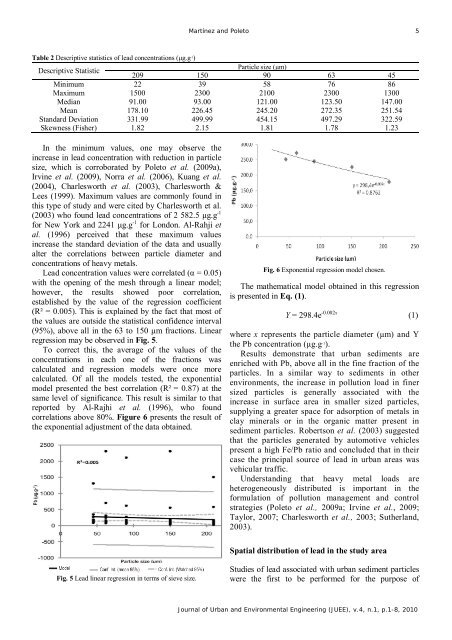
Table 2 Descriptive statistics of lead concentrations (µg.g -1 )<br />
Descriptive Statistic<br />
Particle size (µm)<br />
209 150 90 63 45<br />
Minimum 22 39 58 76 86<br />
Maximum 1500 2300 2100 2300 1300<br />
Median 91.00 93.00 121.00 123.50 147.00<br />
Mean 178.10 226.45 245.20 272.35 251.54<br />
Standard Deviation 331.99 499.99 454.15 497.29 322.59<br />
Skewness (Fisher) 1.82 2.15 1.81 1.78 1.23<br />
In the minimum values, one may observe the<br />
increase in lead concentration with reduction in particle<br />
size, which is corroborated by Poleto et al. (2009a),<br />
Irvine et al. (2009), Norra et al. (2006), Kuang et al.<br />
(2004), Charlesworth et al. (2003), Charlesworth &<br />
Lees (1999). Maximum values are commonly found in<br />
this type of study and were cited by Charlesworth et al.<br />
(2003) who found lead concentrations of 2 582.5 µg.g -1<br />
for New York and 2241 µg.g -1 for London. Al-Rahji et<br />
al. (1996) perceived that these maximum values<br />
increase the standard deviation of the data and usually<br />
alter the correlations between particle diameter and<br />
concentrations of heavy metals.<br />
Lead concentration values were correlated (α = 0.05)<br />
with the opening of the mesh through a linear model;<br />
however, the results showed poor correlation,<br />
established by the value of the regression coefficient<br />
(R² = 0.005). This is explained by the fact that most of<br />
the values are outside the statistical confidence interval<br />
(95%), above all in the 63 to 150 µm fractions. Linear<br />
regression may be observed in Fig. 5.<br />
To correct this, the average of the values of the<br />
concentrations in each one of the fractions was<br />
calculated and regression models were once more<br />
calculated. Of all the models tested, the exponential<br />
model presented the best correlation (R² = 0.87) at the<br />
same level of significance. This result is similar to that<br />
reported by Al-Rajhi et al. (1996), who found<br />
correlations above 80%. Figure 6 presents the result of<br />
the exponential adjustment of the data obtained.<br />
Fig. 6 Exponential regression model chosen.<br />
The mathematical model obtained in this regression<br />
is presented in Eq. (1).<br />
Y = 298.4e -0.002x (1)<br />
where x represents the particle diameter (µm) and Y<br />
the Pb concentration (µg.g -1 ).<br />
Results demonstrate that urban sediments are<br />
enriched with Pb, above all in the fine fraction of the<br />
particles. In a similar way to sediments in other<br />
environments, the increase in pollution load in finer<br />
sized particles is generally associated with the<br />
increase in surface area in smaller sized particles,<br />
supplying a greater space for adsorption of metals in<br />
clay minerals or in the organic matter present in<br />
sediment particles. Robertson et al. (2003) suggested<br />
that the particles generated by automotive vehicles<br />
present a high Fe/Pb ratio and concluded that in their<br />
case the principal source of lead in urban areas was<br />
vehicular traffic.<br />
Understanding that heavy metal loads are<br />
heterogeneously distributed is important in the<br />
formulation of pollution management and control<br />
strategies (Poleto et al., 2009a; Irvine et al., 2009;<br />
Taylor, 2007; Charlesworth et al., 2003; Sutherland,<br />
2003).<br />
Spatial distribution of lead in the study area<br />
Fig. 5 Lead linear regression in terms of sieve size.<br />
Studies of lead associated with urban sediment particles<br />
were the first to be performed for the purpose of<br />
Journal of Urban and Environmental Engineering (JUEE), v.4, n.1, p.1-8, 2010