editorial team
editorial team
editorial team

Create successful ePaper yourself
Turn your PDF publications into a flip-book with our unique Google optimized e-Paper software.
Akpinar and Akpinar<br />
15<br />
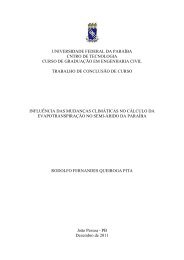
Table 6. The results of statistical analyses according to the model<br />
(RH) for the monthly average relative humidity<br />
Monthly average relative humidity<br />
Model<br />
= a + b·sin(m) + c·sin((m/2) + d)<br />
Constant<br />
constants<br />
Model<br />
City<br />
R χ 2 RMSE<br />
a 58.040<br />
Elazığ b -4.347<br />
0.99 772 1.099 0.872<br />
c 18.755<br />
d 32.524<br />
Predicted values<br />
Erzincan<br />
Erzurum<br />
Kars<br />
Agri<br />
Igdir<br />
Tunceli<br />
Van<br />
Malatya<br />
Bingöl<br />
Muş<br />
Bitlis<br />
Hakkari<br />
90<br />
80<br />
70<br />
60<br />
50<br />
40<br />
30<br />
a<br />
b<br />
c<br />
d<br />
a<br />
b<br />
c<br />
d<br />
a<br />
b<br />
c<br />
d<br />
a<br />
b<br />
c<br />
d<br />
a<br />
b<br />
c<br />
d<br />
a<br />
b<br />
c<br />
d<br />
a<br />
b<br />
c<br />
d<br />
a<br />
b<br />
c<br />
d<br />
a<br />
b<br />
c<br />
d<br />
a<br />
b<br />
c<br />
d<br />
a<br />
b<br />
c<br />
d<br />
a<br />
b<br />
c<br />
d<br />
63.721<br />
-1.975<br />
-12.168<br />
17.077<br />
64.193<br />
-2.596<br />
14.599<br />
51.322<br />
72.1167<br />
-0.5718<br />
8.7419<br />
88.968<br />
70.881<br />
-1.754<br />
11.593<br />
95.207<br />
50.135<br />
-2.866<br />
12.430<br />
-17.219<br />
57.918<br />
-4.836<br />
17.532<br />
20.038<br />
58.635<br />
-3.148<br />
11.330<br />
45.070<br />
53.114<br />
-4.430<br />
19.897<br />
7.473<br />
56.892<br />
-4.236<br />
17.329<br />
32.515<br />
64.806<br />
-4.973<br />
19.633<br />
70.174<br />
69.792<br />
-1.024<br />
12.222<br />
95.400<br />
54.555<br />
-3.332<br />
18.185<br />
0.9574<br />
0.99 382 1.211 0.915<br />
0.98 907 3.167 1.481<br />
0.95 044 5.308 1.917<br />
0.99 479 0.941 0.807<br />
0.97 286 5.918 2.024<br />
0.99 545 1.961 1.165<br />
0.98 484 2.795 1.391<br />
0.99 415 3.163 1.480<br />
0.99 622 1.572 1.043<br />
0.99 549 2.427 1.296<br />
0.98 791 2.373 1.282<br />
0.99 294 3.185 1.485<br />
20<br />
20 30 40 50 60 70 80 90<br />
Observed values<br />
Elazig<br />
Erzincan<br />
Erzurum<br />
Kars<br />
Agri<br />
Igdir<br />
Tunceli<br />
Van<br />
Malatya<br />
Bingöl<br />
Muş<br />
Bitlis<br />
Hakkari<br />
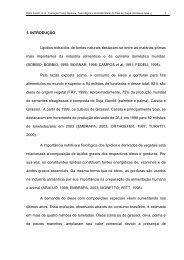
Fig. 9 Observed and predicted values of the monthly average relative<br />
humidity.<br />
Wind speed (m/s)<br />
4<br />
3.5<br />
3<br />
2.5<br />
2<br />
1.5<br />
1<br />
0.5<br />
0<br />
1 2 3 4 5 6 7 8 9 10 11 12<br />
Month<br />
Elazig<br />
Erzincan<br />
Erzurum<br />
Kars<br />
Agri<br />
Igdir<br />
Tunceli<br />
Van<br />
Malatya<br />
Bingöl<br />
Muş<br />
Bitlis<br />
Hakkari<br />
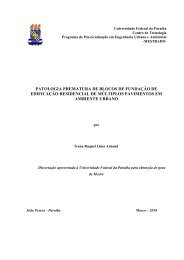
Fig. 10 Monthly average wind speed values during the years 1994–<br />
2003 for the cities.<br />
The monthly average relative humidity<br />
Kars city is the most humid area almost throughout the<br />
period while Igdir is the least humid area. The monthly<br />
average relative humidity showed changing between 63<br />
and 81% for Kars city and 38 and 65% for Igdir city<br />
(Fig. 8). The overall average humidity ratio was about<br />
a57.69% for Elazig, 63.52% for Erzincan, 63.58% for<br />
Erzurum, 71.75% for Kars, 70.41% for Agri, 49.58%<br />
for Igdir, 57.40% for Tunceli, 58.16% for Van, 52.76%<br />
for Malatya, 56.59% for Bingol, 64% for Muş, 69.25%<br />
for Bitlis, 53.83% for Hakkari. While relative humidity<br />
is at highest values in December and January, at lowest<br />
values in July and August.<br />
The simple function of the monthly average relative<br />
humidity (RH) fit the relative humidity data very well.<br />
The results of statistical analyses undertaken on<br />
trigonometric model for the monthly average relative<br />
humidity are given in Table 6. Generally, R, χ 2 and<br />
RMSE values were varied between 0.95 044–0.99 772,<br />
1.099–5.308 and 0.872–1.91, respectively. The function<br />
has coefficients of determination of better than 0.95 and<br />
the lowest values of χ 2 and RMSE for all cities.<br />
Therefore, the trigonometric model (RH) satisfactorily<br />
described characteristics of the monthly average relative<br />
humidity. Considering trigonometric model (RH), the<br />
observed monthly average relative humidity values were<br />
compared with calculated ones. Figure 9 shows the<br />
predicted and observed values of the monthly average<br />
relative humidity. There is a good agreement between<br />
predicted and observed values.<br />
Predicted values<br />
4<br />
3.5<br />
3<br />
2.5<br />
2<br />
1.5<br />
1<br />
0.5<br />
0<br />
0 0.5 1 1.5 2 2.5 3 3.5 4<br />
Elazig<br />
Erzincan<br />
Erzurum<br />
Kars<br />
Agri<br />
Igdir<br />
Tunceli<br />
Van<br />
Malatya<br />
Bingöl<br />
Muş<br />
Bitlis<br />
Hakkari<br />
Observed values<br />
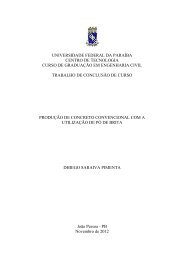
Fig. 11 Observed and predicted values of the monthly average wind<br />
speed.<br />
Journal of Urban and Environmental Engineering (JUEE), v.4, n.1, p.9-22, 2010