editorial team
editorial team
editorial team

You also want an ePaper? Increase the reach of your titles
YUMPU automatically turns print PDFs into web optimized ePapers that Google loves.
Akpinar and Akpinar<br />
17<br />
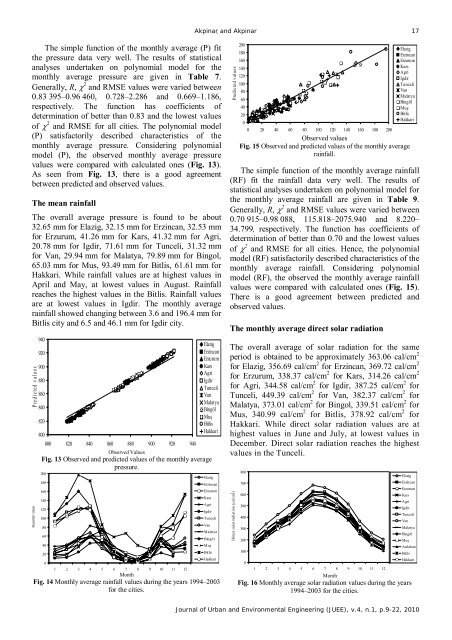
The simple function of the monthly average (P) fit<br />
the pressure data very well. The results of statistical<br />
analyses undertaken on polynomial model for the<br />
monthly average pressure are given in Table 7.<br />
Generally, R, χ 2 and RMSE values were varied between<br />
0.83 395–0.96 460, 0.728–2.286 and 0.669–1.186,<br />
respectively. The function has coefficients of<br />
determination of better than 0.83 and the lowest values<br />
of χ 2 and RMSE for all cities. The polynomial model<br />
(P) satisfactorily described characteristics of the<br />
monthly average pressure. Considering polynomial<br />
model (P), the observed monthly average pressure<br />
values were compared with calculated ones (Fig. 13).<br />
As seen from Fig. 13, there is a good agreement<br />
between predicted and observed values.<br />
The mean rainfall<br />
The overall average pressure is found to be about<br />
32.65 mm for Elazig, 32.15 mm for Erzincan, 32.53 mm<br />
for Erzurum, 41.26 mm for Kars, 41.32 mm for Agri,<br />
20.78 mm for Igdir, 71.61 mm for Tunceli, 31.32 mm<br />
for Van, 29.94 mm for Malatya, 79.89 mm for Bingol,<br />
65.03 mm for Mus, 93.49 mm for Bitlis, 61.61 mm for<br />
Hakkari. While rainfall values are at highest values in<br />
April and May, at lowest values in August. Rainfall<br />
reaches the highest values in the Bitlis. Rainfall values<br />
are at lowest values in Igdir. The monthly average<br />
rainfall showed changing between 3.6 and 196.4 mm for<br />
Bitlis city and 6.5 and 46.1 mm for Igdir city.<br />
Predicted values<br />
Rainfall (mm<br />
940<br />
920<br />
900<br />
880<br />
860<br />
840<br />
820<br />
800<br />
800 820 840 860 880 900 920 940<br />
Elazig<br />
Erzincan<br />
Erzurum<br />
Kars<br />
Agri<br />
Igdir<br />
Tunceli<br />
Van<br />
Malatya<br />
Bingöl<br />
Muş<br />
Bitlis<br />
Hakkari<br />
Observed Values<br />
Fig. 13 Observed and predicted values of the monthly average<br />
pressure.<br />
200<br />
180<br />
160<br />
140<br />
120<br />
100<br />
80<br />
60<br />
40<br />
20<br />
0<br />
1 2 3 4 5 6 7 8 9 10 11 12<br />
Elazig<br />
Erzincan<br />
Erzurum<br />
Kars<br />
Agri<br />
Igdir<br />
Tunceli<br />
Van<br />
Malatya<br />
Bingöl<br />
Muş<br />
Bitlis<br />
Hakkari<br />
Month<br />
Fig. 14 Monthly average rainfall values during the years 1994–2003<br />
for the cities.<br />
Predicted values<br />
200<br />
180<br />
160<br />
140<br />
120<br />
100<br />
80<br />
60<br />
40<br />
20<br />
0<br />
0 20 40 60 80 100 120 140 160 180 200<br />
Elazig<br />
Erzincan<br />
Erzurum<br />
Kars<br />
Agri<br />
Igdir<br />
Tunceli<br />
Van<br />
Malatya<br />
Bingöl<br />
Muş<br />
Bitlis<br />
Hakkari<br />
Observed values<br />
Fig. 15 Observed and predicted values of the monthly average<br />
rainfall.<br />
The simple function of the monthly average rainfall<br />
(RF) fit the rainfall data very well. The results of<br />
statistical analyses undertaken on polynomial model for<br />
the monthly average rainfall are given in Table 9.<br />
Generally, R, χ 2 and RMSE values were varied between<br />
0.70 915–0.98 088, 115.818–2075.940 and 8.220–<br />
34.799, respectively. The function has coefficients of<br />
determination of better than 0.70 and the lowest values<br />
of χ 2 and RMSE for all cities. Hence, the polynomial<br />
model (RF) satisfactorily described characteristics of the<br />
monthly average rainfall. Considering polynomial<br />
model (RF), the observed the monthly average rainfall<br />
values were compared with calculated ones (Fig. 15).<br />
There is a good agreement between predicted and<br />
observed values.<br />
The monthly average direct solar radiation<br />
The overall average of solar radiation for the same<br />
period is obtained to be approximately 363.06 cal/cm 2<br />
for Elazig, 356.69 cal/cm 2 for Erzincan, 369.72 cal/cm 2<br />
for Erzurum, 338.37 cal/cm 2 for Kars, 314.26 cal/cm 2<br />
for Agri, 344.58 cal/cm 2 for Igdir, 387.25 cal/cm 2 for<br />
Tunceli, 449.39 cal/cm 2 for Van, 382.37 cal/cm 2 for<br />
Malatya, 373.01 cal/cm 2 for Bingol, 339.51 cal/cm 2 for<br />
Mus, 340.99 cal/cm 2 for Bitlis, 378.92 cal/cm 2 for<br />
Hakkari. While direct solar radiation values are at<br />
highest values in June and July, at lowest values in<br />
December. Direct solar radiation reaches the highest<br />
values in the Tunceli.<br />
Direct solar radiation (cal/cm 2 )<br />
800<br />
700<br />
600<br />
500<br />
400<br />
300<br />
200<br />
100<br />
0<br />
1 2 3 4 5 6 7 8 9 10 11 12<br />
Elazig<br />
Erzincan<br />
Erzurum<br />
Kars<br />
Agri<br />
Igdir<br />
Tunceli<br />
Van<br />
Malatya<br />
Bingöl<br />
Muş<br />
Ardahan<br />
Bitlis<br />
Hakkari<br />
Month<br />
Fig. 16 Monthly average solar radiation values during the years<br />
1994–2003 for the cities.<br />
Journal of Urban and Environmental Engineering (JUEE), v.4, n.1, p.9-22, 2010