editorial team
editorial team
editorial team

You also want an ePaper? Increase the reach of your titles
YUMPU automatically turns print PDFs into web optimized ePapers that Google loves.
Table 5. The results of statistical analyses according to the model<br />
(AT 3 ) for the monthly average minimum temperature<br />
Monthly average minimum temperature<br />
Model<br />
= a + b·sin(m) + c·sin((m/2) + d)<br />
Constant<br />
constants<br />
Model<br />
City<br />
R χ² RMSE<br />
a 6.6105<br />
Elazığ b 0.9345<br />
0.99 587 0.612 0.651<br />
c -10.65<br />
d 1.0598<br />
Erzincan<br />
Erzurum<br />
Kars<br />
Agri<br />
Igdir<br />
Tunceli<br />
Van<br />
Malatya<br />
Bingöl<br />
Muş<br />
Bitlis<br />
Hakkari<br />
a<br />
b<br />
c<br />
d<br />
a<br />
b<br />
c<br />
d<br />
a<br />
b<br />
c<br />
d<br />
a<br />
b<br />
c<br />
d<br />
a<br />
b<br />
c<br />
d<br />
a<br />
b<br />
c<br />
d<br />
a<br />
b<br />
c<br />
d<br />
a<br />
b<br />
c<br />
d<br />
a<br />
b<br />
c<br />
d<br />
a<br />
b<br />
c<br />
d<br />
a<br />
b<br />
c<br />
d<br />
a<br />
b<br />
c<br />
d<br />
5.2303<br />
0.4802<br />
-10.804<br />
1.1158<br />
-2.9692<br />
-0.54468<br />
-12.450<br />
1.1088<br />
-1.4663<br />
-0.4760<br />
-12.415<br />
1.1056<br />
-0.2878<br />
-0.6481<br />
-13.192<br />
1.0772<br />
6.0989<br />
0.7160<br />
-12.440<br />
1.1732<br />
6.7410<br />
0.8648<br />
-11.326<br />
1.0893<br />
4.8203<br />
0.7447<br />
-10.920<br />
1.0275<br />
8.1937<br />
0.9545<br />
-11.172<br />
1.0725<br />
6.6144<br />
0.6555<br />
-11.942<br />
1.0754<br />
4.4451<br />
-0.06851<br />
-13.0715<br />
1.0561<br />
4.3441<br />
0.6756<br />
-10.589<br />
1.0588<br />
4.944<br />
0.6985<br />
-13.086<br />
1.0560<br />
0.99 727 0.461 0.554<br />
0.99 206 1.593 1.050<br />
0.99 437 1.119 0.880<br />
0.99 326 1.519 1.025<br />
0.99 720 0.558 0.622<br />
0.99 630 0.616 0.653<br />
0.99 781 0.340 0.485<br />
0.99 804 0.318 0.469<br />
0.99 725 0.508 0.593<br />
0.99 544 1.006 0.834<br />
0.99 688 0.454 0.561<br />
0.99 906 0.208 0.379<br />
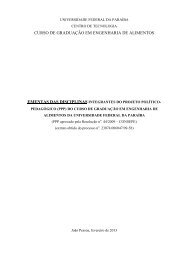
for Erzincan, -2.40 o C for Erzurum, -0.90 o C for Kars,<br />
0.3 o C for Agri, 6.65 o C for Igdir, 7.23 o C for Tunceli,<br />
5.28 o C for Van, 8.67 o C for Malatya, 7.13 o C for Bingöl,<br />
5.01 o C for Muş, 4.8 o C for Bitlis, 5.50 o C for Hakkari<br />
(Fig. 6). While minimum temperatures are at highest<br />
values in July, at lowest values in January and February.<br />
Minimum temperatures reach the warmest values in the<br />
Malatya. The monthly average minimum temperatures<br />
demonstrated changing between -1.5 and 20.3°C for<br />
Malatya city.<br />
Akpinar and Akpinar<br />
The simple function of the monthly average<br />
minimum temperature (AT 3 ) fit the minimum<br />
temperature data very well. The results of statistical<br />
analyses undertaken on trigonometric model for the<br />
monthly average minimum temperature are given in<br />
Table 5. Generally, R, χ 2 and RMSE values were varied<br />
between 0.99 206–0.99 906, 0.208–1.593 and 0.379–<br />
1.050, respectively. The function has coefficients of<br />
determination of better than 0.99 and the lowest values<br />
of χ 2 and RMSE for all cities. Hence, the trigonometric<br />
model (AT 3 ) satisfactorily described characteristics of<br />
the monthly average minimum temperature.<br />
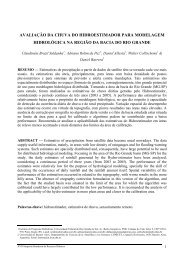
Considering trigonometric model (AT 3 ), the observed<br />
mean minimum monthly temperature values were<br />
compared with calculated ones. Figure 7 shows the<br />
predicted and observed values of the monthly average<br />
minimum temperature. There is a good agreement<br />
between predicted and observed values.<br />
o<br />
Temperature C ( )<br />
P redicted valu<br />
Relative humidity (%<br />
25<br />
20<br />
15<br />
10<br />
5<br />
0<br />
-5<br />
-10<br />
-15<br />
-20<br />
1 2 3 4 5 6 7 8 9 10 11 12<br />
Month<br />
14<br />
Elazig<br />
Erzinc an<br />
Erzu ru m<br />
Kars<br />
Agri<br />
Ig dir<br />
Tunceli<br />
Van<br />
Malatya<br />
Bingöl<br />
Muş<br />
Bitlis<br />
Hakkari<br />
Fig. 6 Monthly average minimum temperatures during the years<br />
1994–2003 for the cities.<br />
25<br />
20<br />
15<br />
10<br />
5<br />
0<br />
-20 -15 -10 -5<br />
-5<br />
0 5 10 15 20 25<br />
-10<br />
-15<br />
-20<br />
Observed values<br />
Elazig<br />
Erzincan<br />
Erzurum<br />
Kars<br />
Agri<br />
Igdir<br />
Tunceli<br />
Van<br />
Malatya<br />
Bingöl<br />
Muş<br />
Bitlis<br />
Hakkari<br />
Fig. 7 Observed and predicted values of the monthly average<br />
minimum temperatures.<br />
90<br />
80<br />
70<br />
60<br />
50<br />
40<br />
30<br />
20<br />
10<br />
0<br />
1 2 3 4 5 6 7 8 9 10 11 12<br />
Month<br />
Elazig<br />
Erzincan<br />
Erzurum<br />
Kars<br />
Agri<br />
Igdir<br />
Tunceli<br />
Van<br />
Malatya<br />
Bingöl<br />
Muş<br />
Bitlis<br />
Hakkari<br />
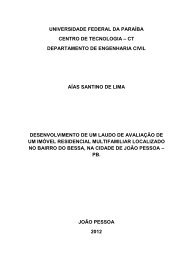
Fig. 8 Monthly average relative humidity values during the years<br />
1994–2003 for the cities.<br />
Journal of Urban and Environmental Engineering (JUEE), v.4, n.1, p.9-22, 2010