editorial team
editorial team
editorial team

Create successful ePaper yourself
Turn your PDF publications into a flip-book with our unique Google optimized e-Paper software.
Braga and Santos<br />
27<br />
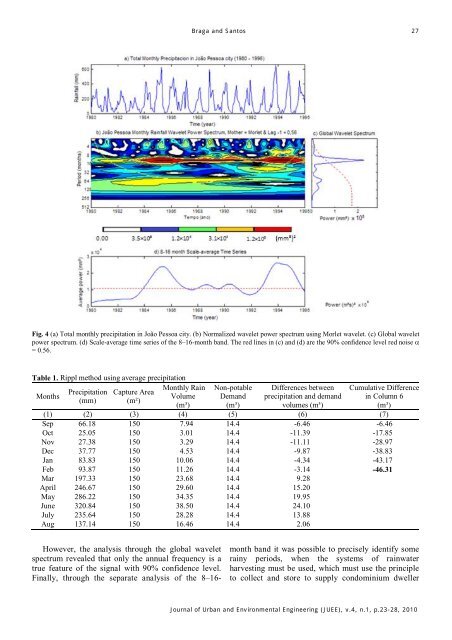
Fig. 4 (a) Total monthly precipitation in João Pessoa city. (b) Normalized wavelet power spectrum using Morlet wavelet. (c) Global wavelet<br />
power spectrum. (d) Scale-average time series of the 8–16-month band. The red lines in (c) and (d) are the 90% confidence level red noise α<br />
= 0.56.<br />
Table 1. Rippl method using average precipitation<br />
Months<br />
Precipitation<br />
(mm)<br />
Capture Area<br />
(m²)<br />
Monthly Rain<br />
Volume<br />
(m³)<br />
Non-potable<br />
Demand<br />
(m³)<br />
Differences between<br />
precipitation and demand<br />
volumes (m³)<br />
Cumulative Difference<br />
in Column 6<br />
(m³)<br />
(1) (2) (3) (4) (5) (6) (7)<br />
Sep 66.18 150 7.94 14.4 -6.46 -6.46<br />
Oct 25.05 150 3.01 14.4 -11.39 -17.85<br />
Nov 27.38 150 3.29 14.4 -11.11 -28.97<br />
Dec 37.77 150 4.53 14.4 -9.87 -38.83<br />
Jan 83.83 150 10.06 14.4 -4.34 -43.17<br />
Feb 93.87 150 11.26 14.4 -3.14 -46.31<br />
Mar 197.33 150 23.68 14.4 9.28<br />
April 246.67 150 29.60 14.4 15.20<br />
May 286.22 150 34.35 14.4 19.95<br />
June 320.84 150 38.50 14.4 24.10<br />
July 235.64 150 28.28 14.4 13.88<br />
Aug 137.14 150 16.46 14.4 2.06<br />
However, the analysis through the global wavelet<br />
spectrum revealed that only the annual frequency is a<br />
true feature of the signal with 90% confidence level.<br />
Finally, through the separate analysis of the 8–16-<br />
month band it was possible to precisely identify some<br />
rainy periods, when the systems of rainwater<br />
harvesting must be used, which must use the principle<br />
to collect and store to supply condominium dweller<br />
Journal of Urban and Environmental Engineering (JUEE), v.4, n.1, p.23-28, 2010