editorial team
editorial team
editorial team

You also want an ePaper? Increase the reach of your titles
YUMPU automatically turns print PDFs into web optimized ePapers that Google loves.
Gobinath and Nagendran<br />
the campus. A comprehensive waste water<br />
characterization was done or the available reliable data<br />
will be used for the calculations and analysis. This was<br />
done by calculating the following<br />
• Real time water source finding – University water<br />
supply data was taken from the Estate office or from the<br />
different departments and the storage methods was<br />
analyzed.<br />
• Trends of water usage for Gardening, Laboratory,<br />
Canteen, official purposes was calculated by taking real<br />
time reading with the departments of the University and<br />
with secondary data available in Estate office.<br />
• Per capita water consumption for the University for<br />
the past one decade was arrived with the data calculated<br />
and secondary data.<br />
Water Audit is done with the following method:<br />
Water Lost = Water supply – Wastewater discharge ×<br />
Wastewater discharge<br />
Water Lost = (operational time of the pumps, h/d) ×<br />
(pumps’ capacity, m³/h)<br />
Water usage pattern<br />
To find out the usage of water for the university<br />
activities the detailed water audit was conducted and the<br />
flow of water from the starting point is analyzed. Anna<br />
University’s daily water consumption is found to be<br />
0.8 million liters per day including hostels, gardening,<br />
canteen and other usages. The only source of water is<br />
corporation supply of 0.8 million liters per day provided<br />
as continues supply. The internal water sources like<br />
bore well are stopped temporarily and the main water<br />
supply is used all over the campus.<br />
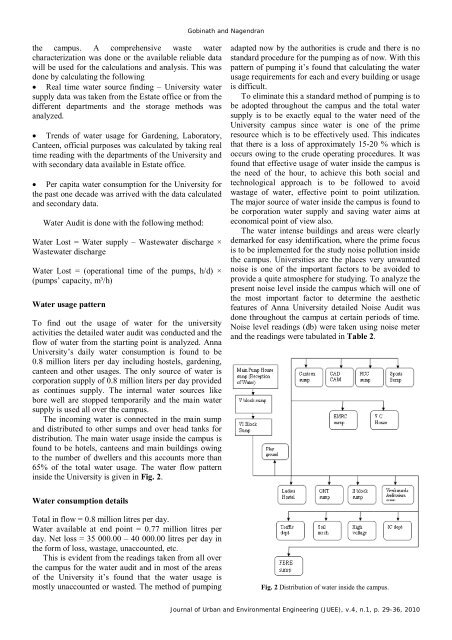
The incoming water is connected in the main sump<br />
and distributed to other sumps and over head tanks for<br />
distribution. The main water usage inside the campus is<br />
found to be hotels, canteens and main buildings owing<br />
to the number of dwellers and this accounts more than<br />
65% of the total water usage. The water flow pattern<br />
inside the University is given in Fig. 2.<br />
adapted now by the authorities is crude and there is no<br />
standard procedure for the pumping as of now. With this<br />
pattern of pumping it’s found that calculating the water<br />
usage requirements for each and every building or usage<br />
is difficult.<br />
To eliminate this a standard method of pumping is to<br />
be adopted throughout the campus and the total water<br />
supply is to be exactly equal to the water need of the<br />
University campus since water is one of the prime<br />
resource which is to be effectively used. This indicates<br />
that there is a loss of approximately 15-20 % which is<br />
occurs owing to the crude operating procedures. It was<br />
found that effective usage of water inside the campus is<br />
the need of the hour, to achieve this both social and<br />
technological approach is to be followed to avoid<br />
wastage of water, effective point to point utilization.<br />
The major source of water inside the campus is found to<br />
be corporation water supply and saving water aims at<br />
economical point of view also.<br />
The water intense buildings and areas were clearly<br />
demarked for easy identification, where the prime focus<br />
is to be implemented for the study noise pollution inside<br />
the campus. Universities are the places very unwanted<br />
noise is one of the important factors to be avoided to<br />
provide a quite atmosphere for studying. To analyze the<br />
present noise level inside the campus which will one of<br />
the most important factor to determine the aesthetic<br />
features of Anna University detailed Noise Audit was<br />
done throughout the campus at certain periods of time.<br />
Noise level readings (db) were taken using noise meter<br />
and the readings were tabulated in Table 2.<br />
Water consumption details<br />
Total in flow = 0.8 million litres per day.<br />
Water available at end point = 0.77 million litres per<br />
day. Net loss = 35 000.00 – 40 000.00 litres per day in<br />
the form of loss, wastage, unaccounted, etc.<br />
This is evident from the readings taken from all over<br />
the campus for the water audit and in most of the areas<br />
of the University it’s found that the water usage is<br />
mostly unaccounted or wasted. The method of pumping<br />
Fig. 2 Distribution of water inside the campus.<br />
Journal of Urban and Environmental Engineering (JUEE), v.4, n.1, p. 29-36, 2010