Annandale Transportation Study - Fairfax County Office of ...
Annandale Transportation Study - Fairfax County Office of ...
Annandale Transportation Study - Fairfax County Office of ...

Create successful ePaper yourself
Turn your PDF publications into a flip-book with our unique Google optimized e-Paper software.
<strong>Annandale</strong> <strong>Transportation</strong> <strong>Study</strong> – Final Report<br />
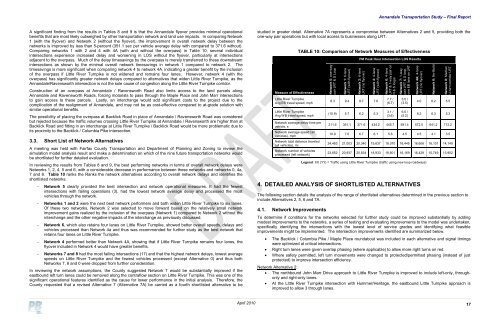
A significant finding from the results in Tables 8 and 9 is that the <strong>Annandale</strong> flyover provides minimal operational<br />
benefits that are most likely outweighed by other transportation network and land use impacts. In comparing Network<br />
1 (with the flyover) and Network 2 (without the flyover), the improvement in overall network delay between the<br />
networks is improved by less than 5-percent (351.1 sec per vehicle average delay with compared to 371.6 without).<br />
Comparing networks 1 with 2 and 4 with 4A (with and without the overpass) in Table 10, several individual<br />
intersections experience increased delay and worsening in LOS without the flyover, particularly at intersections<br />
adjacent to the overpass. Much <strong>of</strong> the delay timesavings by the overpass is merely transferred to these downstream<br />
intersections as shown by the minimal overall network timesavings in network 1 compared to network 2. The<br />
timesavings is more significant when comparing network 4 to network 4A, indicating a greater benefit by the inclusion<br />
<strong>of</strong> the overpass if Little River Turnpike is not widened and remains four lanes. However, network 4 (with the<br />
overpass) has significantly greater network delays compared to alternatives that widen Little River Turnpike, as the<br />
<strong>Annandale</strong>/Ravensworth intersection is not the sole cause <strong>of</strong> congestion along the Little River Turnpike corridor.<br />
Construction <strong>of</strong> an overpass at <strong>Annandale</strong> / Ravensworth Road also limits access to the land parcels along<br />
<strong>Annandale</strong> and Ravensworth Roads, forcing motorists to pass through the Maple Place and John Marr intersections<br />
to gain access to these parcels. Lastly, an interchange would add significant costs to the project due to the<br />
complication <strong>of</strong> the realignment <strong>of</strong> <strong>Annandale</strong>, and may not be as cost-effective compared to at-grade solution with<br />
similar operational benefits.<br />
The possibility <strong>of</strong> placing the overpass at Backlick Road in place <strong>of</strong> <strong>Annandale</strong> / Ravensworth Road was considered<br />
but rejected because the traffic volumes crossing Little River Turnpike at <strong>Annandale</strong> / Ravensworth are higher than at<br />
Backlick Road and fitting in an interchange at Little River Turnpike / Backlick Road would be more problematic due to<br />
its proximity to the Backlick / Columbia Pike intersection.<br />
3.3. Short List <strong>of</strong> Network Alternatives<br />
A meeting was held with <strong>Fairfax</strong> <strong>County</strong> <strong>Transportation</strong> and Department <strong>of</strong> Planning and Zoning to review the<br />
simulation model analysis result and make a determination on which <strong>of</strong> the nine future transportation networks would<br />
be shortlisted for further detailed evaluation.<br />
In reviewing the results from Tables 8 and 9, the best performing networks in terms <strong>of</strong> overall network delays were<br />
Networks 1, 2, 4, 5 and 6, with a considerable decrease in performance between these networks and networks 0, 4a,<br />
7 and 8. Table 10 ranks the Ranks the network alternatives according to overall network delays and identifies the<br />
shortlisted networks.<br />
<br />
<br />
<br />
<br />
<br />
Network 5 clearly provided the best intersection and network operational measures. It had the fewest<br />
intersections with failing operations (3), had the lowest network average delay and processed the most<br />
vehicles through the network.<br />
Networks 1 and 2 were the next best network performers and both widen Little River Turnpike to six lanes.<br />
Of these two networks, Network 2 was selected to move forward based on the relatively small network<br />
improvement gains realized by the inclusion <strong>of</strong> the overpass (Network 1) compared to Network 2 without the<br />
interchange and the other negative impacts <strong>of</strong> the interchange as previously discussed.<br />
Network 6, which also retains four lanes on Little River Turnpike, showed better overall speeds, delays and<br />
vehicles processed than Network 4a and thus was recommended for further study as the best network that<br />
retains four lanes on Little River Turnpike.<br />
Network 4 performed better than Network 4A, showing that if Little River Turnpike remains four lanes, the<br />
flyover included in Network 4 would have greater benefits.<br />
Networks 7 and 8 had the most failing intersections (17) and that the highest network delays, lowest average<br />
speeds on Little River Turnpike and the fewest vehicles processed (except Alternative 0) and thus both<br />
Networks 7, 8 and 0 were dropped from further consideration.<br />
In reviewing the network assumptions, the <strong>County</strong> suggested Network 7 would be substantially improved if the<br />
eastbound left turn lanes could be removed along the contraflow section on Little River Turnpike. This was one <strong>of</strong> the<br />
significant operational features identified as the cause for lower performance in the initial analysis. Therefore, the<br />
<strong>County</strong> requested that a revised Alternative 7 (Alternative 7A) be carried as a fourth shortlisted alternative to be<br />
studied in greater detail. Alternative 7A represents a compromise between Alternatives 2 and 5, providing both the<br />
one-way pair operations but with local access to businesses along LRT.<br />
Measure <strong>of</strong> Effectiveness<br />
Little River Turnpike<br />
Avg EB travel speed, mph<br />
Little River Turnpike<br />
Avg WB travel speed, mph<br />
Network average delay time per<br />
vehicle, s<br />
Network average speed (all<br />
vehicles), mph<br />
Network total distance traveled<br />
(all vehicles), mi<br />
Network number <strong>of</strong> vehicles<br />
processed (left network)<br />
TABLE 10: Comparison <strong>of</strong> Network Measures <strong>of</strong> Effectiveness<br />
Network 5: one-way<br />
pair LRT & S Loop<br />
Network 1: 6-lane<br />
LRT (with flyover)<br />
PM Peak Hour Intersection LOS Results<br />
Network 2: 6-lane<br />
LRT (no flyover)<br />
Network 4: 4-lane<br />
LRT (with flyover)<br />
8.3 9.4 8.7 7.6<br />
(10.9) 5.7 6.2 5.3<br />
Network 6: 4-lane<br />
LRT & 1-way pair on<br />
N & S loops<br />
7.7 /<br />
(6.7)<br />
3.1 /<br />
(3.6)<br />
Network 7: 1-way<br />
pair LRT & S loop,<br />
one EB lane on LRT<br />
3.5 /<br />
(3.5)<br />
6.5 /<br />
(5.2)<br />
Network 4A: 4-lane<br />
LRT (no flyover)<br />
Network 0: No-Build<br />
Network 8: Median<br />
U-turn corridor LRT<br />
4.0 6.2 5.5<br />
8.2 6.3 5.3<br />
211.6 351.1 371.6 434.2 445.7 591.4 572.5 641.2 712.2<br />
10.9 7.0 6.7 6.1 5.6 4.5 4.5 4.1 3.5<br />
24,483 21,003 20,340 19,637 18,070 16,445 16,606 16,101 14,149<br />
23,652 20,937 20,834 18,933 18,601 16,169 16,429 15,749 13,902<br />
Legend: XX (YY) = Traffic using Little River Turnpike (traffic using new loop roadways)<br />
4. DETAILED ANALYSIS OF SHORTLISTED ALTERNATIVES<br />
The following section details the analysis <strong>of</strong> the range <strong>of</strong> shortlisted alternatives determined in the previous section to<br />
include Alternatives 2, 5, 6 and 7A.<br />
4.1. Network Improvements<br />
To determine if conditions for the networks selected for further study could be improved substantially by adding<br />
modest improvements to the networks, a series <strong>of</strong> testing and evaluating improvements to the model was undertaken,<br />
specifically identifying the intersections with the lowest level <strong>of</strong> service grades and identifying what feasible<br />
improvements might be implemented. The intersection improvements identified are summarized below.<br />
<br />
<br />
<br />
The Backlick / Columbia Pike / Maple Place roundabout was included in each alternative and signal timings<br />
were optimized at critical intersections.<br />
Right turn lanes were given overlap phasing (where applicable) to allow more right turns on red.<br />
Where safety permitted, left turn movements were changed to protected/permitted phasing (instead <strong>of</strong> just<br />
protected) to improve intersection efficiency.<br />
Network Alternative 2:<br />
The northbound John Marr Drive approach to Little River Turnpike is improved to include left-only, throughonly<br />
and right-only lanes.<br />
At the Little River Turnpike intersection with Hummer/Heritage, the eastbound Little Turnpike approach is<br />
improved to allow 3 through lanes.<br />
April 2010<br />
17