Digital scanning sonar for fish feeding monitoring in ... - BioSonics, Inc
Digital scanning sonar for fish feeding monitoring in ... - BioSonics, Inc
Digital scanning sonar for fish feeding monitoring in ... - BioSonics, Inc

Create successful ePaper yourself
Turn your PDF publications into a flip-book with our unique Google optimized e-Paper software.
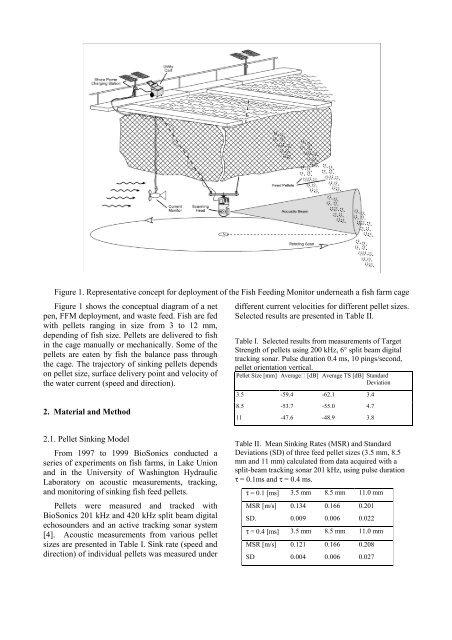
Figure 1. Representative concept <strong>for</strong> deployment of the Fish Feed<strong>in</strong>g Monitor underneath a <strong>fish</strong> farm cage<br />
Figure 1 shows the conceptual diagram of a net<br />
pen, FFM deployment, and waste feed. Fish are fed<br />
with pellets rang<strong>in</strong>g <strong>in</strong> size from 3 to 12 mm,<br />
depend<strong>in</strong>g of <strong>fish</strong> size. Pellets are delivered to <strong>fish</strong><br />
<strong>in</strong> the cage manually or mechanically. Some of the<br />
pellets are eaten by <strong>fish</strong> the balance pass through<br />
the cage. The trajectory of s<strong>in</strong>k<strong>in</strong>g pellets depends<br />
on pellet size, surface delivery po<strong>in</strong>t and velocity of<br />
the water current (speed and direction).<br />
2. Material and Method<br />
different current velocities <strong>for</strong> different pellet sizes.<br />
Selected results are presented <strong>in</strong> Table II.<br />
Table I. Selected results from measurements of Target<br />
Strength of pellets us<strong>in</strong>g 200 kHz, 6° split beam digital<br />
track<strong>in</strong>g <strong>sonar</strong>. Pulse duration 0.4 ms, 10 p<strong>in</strong>gs/second,<br />
pellet orientation vertical.<br />
Pellet Size [mm] Average [dB] Average TS [dB] Standard<br />
Deviation<br />
3.5 -59.4 -62.1 3.4<br />
8.5 -53.7 -55.0 4.7<br />
11 -47.6 -48.9 3.8<br />
2.1. Pellet S<strong>in</strong>k<strong>in</strong>g Model<br />
From 1997 to 1999 <strong>BioSonics</strong> conducted a<br />
series of experiments on <strong>fish</strong> farms, <strong>in</strong> Lake Union<br />
and <strong>in</strong> the University of Wash<strong>in</strong>gton Hydraulic<br />
Laboratory on acoustic measurements, track<strong>in</strong>g,<br />
and <strong>monitor<strong>in</strong>g</strong> of s<strong>in</strong>k<strong>in</strong>g <strong>fish</strong> feed pellets.<br />
Pellets were measured and tracked with<br />
<strong>BioSonics</strong> 201 kHz and 420 kHz split beam digital<br />
echosounders and an active track<strong>in</strong>g <strong>sonar</strong> system<br />
[4]. Acoustic measurements from various pellet<br />
sizes are presented <strong>in</strong> Table I. S<strong>in</strong>k rate (speed and<br />
direction) of <strong>in</strong>dividual pellets was measured under<br />
Table II. Mean S<strong>in</strong>k<strong>in</strong>g Rates (MSR) and Standard<br />
Deviations (SD) of three feed pellet sizes (3.5 mm, 8.5<br />
mm and 11 mm) calculated from data acquired with a<br />
split-beam track<strong>in</strong>g <strong>sonar</strong> 201 kHz, us<strong>in</strong>g pulse duration<br />
τ = 0.1ms and τ = 0.4 ms.<br />
τ = 0.1 [ms] 3.5 mm 8.5 mm 11.0 mm<br />
MSR [m/s] 0.134 0.166 0.201<br />
SD. 0.009 0.006 0.022<br />
τ = 0.4 [ms] 3.5 mm 8.5 mm 11.0 mm<br />
MSR [m/s] 0.121 0.166 0.208<br />
SD 0.004 0.006 0.027