Target Strength of Southern Resident Killer Whales ... - BioSonics, Inc
Target Strength of Southern Resident Killer Whales ... - BioSonics, Inc
Target Strength of Southern Resident Killer Whales ... - BioSonics, Inc

You also want an ePaper? Increase the reach of your titles
YUMPU automatically turns print PDFs into web optimized ePapers that Google loves.
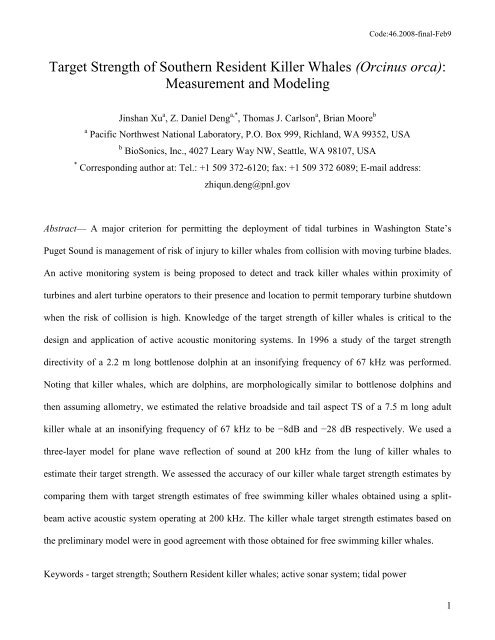
Code:46.2008-final-Feb9<br />
<strong>Target</strong> <strong>Strength</strong> <strong>of</strong> <strong>Southern</strong> <strong>Resident</strong> <strong>Killer</strong> <strong>Whales</strong> (Orcinus orca):<br />
Measurement and Modeling<br />
Jinshan Xu a , Z. Daniel Deng a,* , Thomas J. Carlson a , Brian Moore b<br />
a Pacific Northwest National Laboratory, P.O. Box 999, Richland, WA 99352, USA<br />
b <strong>BioSonics</strong>, <strong>Inc</strong>., 4027 Leary Way NW, Seattle, WA 98107, USA<br />
* Corresponding author at: Tel.: +1 509 372-6120; fax: +1 509 372 6089; E-mail address:<br />
zhiqun.deng@pnl.gov<br />
Abstract— A major criterion for permitting the deployment <strong>of</strong> tidal turbines in Washington State’s<br />
Puget Sound is management <strong>of</strong> risk <strong>of</strong> injury to killer whales from collision with moving turbine blades.<br />
An active monitoring system is being proposed to detect and track killer whales within proximity <strong>of</strong><br />
turbines and alert turbine operators to their presence and location to permit temporary turbine shutdown<br />
when the risk <strong>of</strong> collision is high. Knowledge <strong>of</strong> the target strength <strong>of</strong> killer whales is critical to the<br />
design and application <strong>of</strong> active acoustic monitoring systems. In 1996 a study <strong>of</strong> the target strength<br />
directivity <strong>of</strong> a 2.2 m long bottlenose dolphin at an insonifying frequency <strong>of</strong> 67 kHz was performed.<br />
Noting that killer whales, which are dolphins, are morphologically similar to bottlenose dolphins and<br />
then assuming allometry, we estimated the relative broadside and tail aspect TS <strong>of</strong> a 7.5 m long adult<br />
killer whale at an insonifying frequency <strong>of</strong> 67 kHz to be −8dB and −28 dB respectively. We used a<br />
three-layer model for plane wave reflection <strong>of</strong> sound at 200 kHz from the lung <strong>of</strong> killer whales to<br />
estimate their target strength. We assessed the accuracy <strong>of</strong> our killer whale target strength estimates by<br />
comparing them with target strength estimates <strong>of</strong> free swimming killer whales obtained using a splitbeam<br />
active acoustic system operating at 200 kHz. The killer whale target strength estimates based on<br />
the preliminary model were in good agreement with those obtained for free swimming killer whales.<br />
Keywords - target strength; <strong>Southern</strong> <strong>Resident</strong> killer whales; active sonar system; tidal power<br />
1
Code:46.2008-final-Feb9<br />
I. INTRODUCTION<br />
Prototype marine hydrokinetic energy devices are in the process <strong>of</strong> being deployed in coastal waters to<br />
evaluate their performance and any environmental consequences <strong>of</strong> operation. No tidal power generating<br />
devices are currently deployed in the United States. A Federal Energy Regulatory Commission<br />
preliminary permit has been granted to Snohomish County Public Utility District No. 1 to deploy two<br />
tidal turbines built by OpenHydro (Dublin, Ireland) at a site in Admiralty Inlet in Washington’s Puget<br />
Sound to study their operation over a 5-year period. A criterion for final approval for deployment <strong>of</strong> tidal<br />
turbines by regulatory authorities is demonstration <strong>of</strong> capability to manage the risk <strong>of</strong> injury to killer<br />
whales from strike by moving turbine blades. Pacific Northwest National Laboratory researchers are<br />
designing and testing a prototype <strong>of</strong> a marine mammal alert system (MMAS) for detecting the presence<br />
<strong>of</strong> killer whales in the immediate vicinity <strong>of</strong> tidal turbines. The system will inform tidal turbine operators<br />
about the presence <strong>of</strong> the killer whales to facilitate shut down <strong>of</strong> the turbines when there is high risk <strong>of</strong><br />
collision <strong>of</strong> the whale with the operating turbine. Both passive and active monitoring systems are being<br />
considered for the MMAS. The passive monitoring system is being developed by modifying an energybased<br />
juvenile salmon acoustic telemetry system (McMichael et al., 2010; Deng et al. 2011; Weiland et<br />
al., 2011). Several commercially available sonars are being evaluated for the active monitoring system.<br />
An object in water with acoustic impedance different from water scatters a portion <strong>of</strong> acoustic energy<br />
incident from an active acoustic source back toward the insonifying acoustic system or other receivers<br />
within range. The ratio <strong>of</strong> energy incident on the object to that backscattered from the object is defined as<br />
the target strength (TS) for the object. With the exception <strong>of</strong> a sphere <strong>of</strong> uniform composition, the target<br />
strength <strong>of</strong> an object, such as a fish or whale, is a complex function <strong>of</strong> the shape <strong>of</strong> the object and its<br />
orientation to the insonifying sonar system. <strong>Target</strong> strength is a parameter in the sonar equation and is<br />
required for the design <strong>of</strong> a sonar system to optimize design for detection <strong>of</strong> the targets <strong>of</strong> interest. The<br />
2
Code:46.2008-final-Feb9<br />
TS <strong>of</strong> an object is not single valued but a complex function <strong>of</strong> geometry, size, composition, and frequency<br />
<strong>of</strong> the insonifying sound. The TS <strong>of</strong> simple geometric shapes with acoustic impedance significantly<br />
different from water can be accurately derived analytically. The TS <strong>of</strong> more complicated shapes with<br />
complex composition are typically experimentally determined. However, when measurement <strong>of</strong> TS is not<br />
feasible because <strong>of</strong> cost or technical constraints, such as the case with killer whales, a combination <strong>of</strong><br />
analytical analysis and numerical simulation with consideration <strong>of</strong> the composition <strong>of</strong> complex objects<br />
can be used to estimate TS.<br />
Experimental determination <strong>of</strong> the TS <strong>of</strong> animals such as fish is typically done in a laboratory where<br />
the animal or acoustic measurement system can be manipulated to insonify the whole animal or parts <strong>of</strong><br />
the animal over a range <strong>of</strong> aspects (Love, 1971; Foote, 1980; Clay, 1991; Reeder and Stanton, 2004;<br />
Reeder et al., 2004). For large animals, such as whales, very few TS measurements have been reported<br />
due to the technical difficulty <strong>of</strong> performing TS measurements on unconstrained animals in the open<br />
ocean. The first measurement <strong>of</strong> a sperm whale was made by Dunn (1969) using an explosive charge as<br />
the sound source and a calibrated sonobuoy as the receiver. Dunn reported a TS <strong>of</strong> −8 dB at 1 kHz for an<br />
adult sperm whale. Levenson (1974) reported a similar bistatic maximum TS <strong>of</strong> 14.4 dB at a center<br />
frequency <strong>of</strong> 12 kHz for sperm whales. Love (1971) measured the TS <strong>of</strong> humpback whales at a range <strong>of</strong><br />
about 70 m. Love reported the TS <strong>of</strong> a 14 m adult humpback insonified at 20 kHz to be 7 dB near side<br />
aspect and −4 dB near head side aspect. The TS <strong>of</strong> a 9 m long juvenile humpback was reported to have a<br />
TS <strong>of</strong> 2 dB near broadside aspect at 10 kHz (Love, 1971). Miller and Potter (2001) reported two TS<br />
measurements made at sea for humpback and northern right whales with an 86.25-kHz continuous-wave<br />
3-ms duration pulse transmitted by a phased-array sonar. The broadside TS <strong>of</strong> an adult humpback whale<br />
was observed to be 4 dB. Miller and Potter observed the broadside TS <strong>of</strong> a 15 m long right whale to be<br />
between −4 and −8 dB; they also reported that the head aspect TS <strong>of</strong> 8 m long juvenile right whales<br />
3
Code:46.2008-final-Feb9<br />
ranges between −7 to −13 dB. Most recently, Lucifredi and Stein (2007) reported an aspect-dependent<br />
gray whale TS measurement taken at about 500-m range using a vertical line array sonar frequency<br />
centered at 23 kHz. The reported TS measurements for adult gray whales ranged from −2.9 dB at tail<br />
aspect to 12.8 dB at broadside aspect. An active sonar system was used to study killer whale hunting<br />
behavior in Norwegian waters (Simila, 1997; Nottestad and Axelson, 1999; Nottestad and Simila, 2001;<br />
Nottestad et al., 2002a, 2002b). A comprehensive and relatively well-controlled experiment was<br />
conducted to insonify a tagged killer whale using two commercial active sonar systems (the Simrad<br />
Model SP90 (20-30 kHz) and Simrad Model SH80 (110 to 120 kHz), Kongsberg Maritime AS, Horten,<br />
Norway). The goal <strong>of</strong> the study was to evaluate the feasibility <strong>of</strong> using active acoustic systems to detect<br />
killer whales and observe their behavior in the L<strong>of</strong>oten fjords <strong>of</strong> Northern Norway (Kvadsheim et al.,<br />
2007). However, TS observations <strong>of</strong> killer whales, if obtained during this study, were not reported. Au<br />
(1996) measured the TS directivity at 67 kHz <strong>of</strong> a well-trained bottlenose dolphin in a pool like facility.<br />
He also insonified parts <strong>of</strong> the dolphin to identify the major contributors to whole body TS. Au observed<br />
relatively low TS for most portions <strong>of</strong> the dolphin's body with exception <strong>of</strong> strong echoes from the lungs.<br />
Au’s observations indicate that the air filled lung <strong>of</strong> whales, and presumably other marine mammals, is a<br />
major reflector <strong>of</strong> sound, which is similar to findings for fish that indicate that the swim bladder is the<br />
major reflector <strong>of</strong> sound in the species <strong>of</strong> fish that have one (Clay and Horne, 1994).<br />
The target strength measurements for large marine mammal at sea are very important but difficult to<br />
obtain. Usually, when these measurements are collected, they are most likely only for a specific animal<br />
and certain frequency and there are a lot <strong>of</strong> gaps that we need to fill before we can apply these<br />
measurements to practical applications. In this paper, we report the preliminary results <strong>of</strong> TS modeling<br />
we performed to extrapolate the TS measurements <strong>of</strong> bottlenose dolphin provided by Au (1996) to killer<br />
whales. We also report the results <strong>of</strong> analysis <strong>of</strong> echo data we acquired for three freely swimming killer<br />
4
Code:46.2008-final-Feb9<br />
whales in 2008 using a 200 kHz split-beam sonar and additional analysis we conducted to explore<br />
differences between the in-field TS measurement <strong>of</strong> killer whales and those we estimated by<br />
extrapolation from Au’s data using a 3 layer acoustic scattering model (Miller and Potter 2001). This<br />
model assumes that the lung is the major sound reflector in whales and estimates the plane wave<br />
backscattering coefficient to account for the acoustic impedance and absorption <strong>of</strong> whales flesh and<br />
blubber at different frequencies. Although it is simple and preliminary, it provides an instructive method<br />
for comparing the available measurement <strong>of</strong> various species at different frequencies and useful<br />
information for practical applications in the future.<br />
A. Measurements<br />
II.<br />
MATERIALS AND METHODS<br />
In 2008, a DT-X Echosounder (<strong>BioSonics</strong>, <strong>Inc</strong>., Seattle, Washington) with a deck unit (<strong>BioSonics</strong>,<br />
<strong>Inc</strong>.) was deployed to continuously monitor for killer whales at Lime Kiln Point on San Juan Island,<br />
Washington State. <strong>BioSonics</strong> DT-X is a 9˚ (horizontal)× 6˚ (vertical) 200 kHz digital split-beam<br />
echosounder, which has been developed and commercially available for the direct measurement <strong>of</strong> target<br />
strength (Carlson and Jackson 1980). The split-beam echosounder has a transducer, which is usually<br />
symmetrically divided into four quadrants (Ehrenberg 1974). This <strong>BioSonics</strong> DT-X echosounder has one<br />
large element whose signal is used to determine the echo amplitude, while three smaller elements are<br />
used to measure the <strong>of</strong>f-axis angles. The primary goal was to demonstrate the capabilities <strong>of</strong> autonomous<br />
scientific hydroacoustics systems by using an active sonar system to study distribution, abundance, and<br />
behavior <strong>of</strong> killer whales moving past Lime Kiln Point.<br />
The first field trial <strong>of</strong> the monitoring system was carried out from the R/V Gato Verde, a catamaran<br />
sailing vessel with better stability than a monohull boat, at a depth <strong>of</strong> 14 m. The system transducer was<br />
5
Code:46.2008-final-Feb9<br />
mounted on a customized aluminum frame deployed at a depth <strong>of</strong> 1 m. The coordinates for the location <strong>of</strong><br />
the transducer were 48° 30.920′ N and 123° 9.168′ W. The transducer was aimed horizontally at a bearing<br />
<strong>of</strong> 238° clockwise from magnetic north. The transducer was connected to the deck unit by power and<br />
digital signal cables. The data collected during this field trial are discussed below.<br />
The <strong>BioSonics</strong> DT-X system could be operated in the range from 5 to 250 m at 200 kHz. The system<br />
transmitted a rectangular pulse 0.4 ms in duration at a rate <strong>of</strong> 2 pulses/second. On May 22, 2008, three<br />
killer whales (two adults and one juvenile) were visually observed passing by the drifting R/V Gato<br />
Verde. The fixed-aim sonar system detected the whales and recorded their approach as shown in the<br />
echogram presented in Figure 1. The three rectangular frames (red dashed lines) in the echogram outline<br />
three time segments containing sequences <strong>of</strong> echoes from the visually observed whales. The killer<br />
whales were within the beam <strong>of</strong> the sonar system for about 3 minutes.<br />
B. Data Analysis<br />
1) Whale Behavior<br />
The killer whale echo sequences were processed to identify the strongest echo returns. The strongest<br />
echo returns in each segment that appeared to be from an individual whale were used to estimate the<br />
individual whale’s TS. The phase information from the split-beam system for each echo return, when<br />
combined with the aiming angles <strong>of</strong> the system’s transducer, permitted the azimuth and elevation angles<br />
to the whales relative to the acoustic axis <strong>of</strong> the transducer to be estimated. The ranges to the targets were<br />
also provided in the system output.<br />
While the echoes from individual whales were easily discerned in the echo sequences, the visual<br />
observations <strong>of</strong> the whales were not sufficiently detailed to unambiguously assign a particular whale to<br />
6
Code:46.2008-final-Feb9<br />
each echo sequence or to the echoes selected for estimation <strong>of</strong> TS. Therefore the target strength estimates<br />
discussed below are not specific to particular whales.<br />
2) <strong>Target</strong> <strong>Strength</strong><br />
The echo returns from the whales were recorded in the <strong>BioSonics</strong> .dt4 format (Biosonics, 2008). A<br />
quadrature amplitude demodulation technique (Proakis, 2000) was applied to the filtered analog echo<br />
signals out <strong>of</strong> the system transducer to provide a digital record <strong>of</strong> the echo returns with a sampling<br />
frequency <strong>of</strong> 41.667 kHz. The target strength was estimated by compensating the beam pattern in the<br />
relevant direction relative to the on-axis direction. The detection threshold was set at −70 dB re 1μPa to<br />
allow the target to be detected only in the direction on the beam axis.<br />
3) Aspect Direction/<strong>Inc</strong>ident Angle<br />
The split-beam system processed the echo returns to estimate the azimuth and elevation <strong>of</strong> received<br />
echoes relative to the transducer’s aiming direction. The angle <strong>of</strong> incidence <strong>of</strong> the transmitted pulse on a<br />
whale was estimated by computing the angle <strong>of</strong> travel <strong>of</strong> the whale relative to the acoustic axis <strong>of</strong> the<br />
system transducer from changes in range to the whale on successive echo returns. When range was<br />
increasing the whale was assumed to be near tail aspect and when range was decreasing the whale was<br />
assumed to be near head aspect. Similar methods have been used by others, specifically Levenson (1974)<br />
and Lucifredi (2007).<br />
4) <strong>Target</strong> <strong>Strength</strong> Modeling <strong>of</strong> <strong>Killer</strong> <strong>Whales</strong> at 67 kHz<br />
Assuming allometry in lung size between species <strong>of</strong> dolphins we used the TS directivity data <strong>of</strong> Au<br />
(1996) for a bottlenose dolphin to estimate the aspect dependent TS for killer whales. In Au’s study, a<br />
female bottlenose dolphin weighing 126 kg and measuring 2.2 m in length was trained to remain<br />
stationary at a ―bite‖ station while it was insonified to determine its TS. The transducers <strong>of</strong> the<br />
7
Code:46.2008-final-Feb9<br />
measurement system were manipulated to obtain the TS directivity (i.e., aspect dependent TS) <strong>of</strong> the<br />
dolphin. Three different signals were used to measure the animal’s TS (two frequency-modulated pulses<br />
and a broadband click with a peak frequency <strong>of</strong> 67 kHz). The target strength estimates at each aspect<br />
were averages from echoes <strong>of</strong> 20 pings acquired for each angle <strong>of</strong> insonification <strong>of</strong> the whole dolphin or<br />
<strong>of</strong> specific portions <strong>of</strong> the dolphin (Au, 1996). The ratio <strong>of</strong> the lung length to the full body length <strong>of</strong> this<br />
dolphin was about 0.286. Assuming that dolphins and killer whales share a similar morphological<br />
structure and that lung size is proportional, a 7.5 m long killer whale (mature female) would have a lung<br />
length <strong>of</strong> about 2.143 m. Given the difference in TS <strong>of</strong> a 0.6-m-diameter sphere and 2.143-m-diameter<br />
sphere is about 10.77 dB (Urick, 1983) we estimate that a 7.5 m long killer whale will have a TS at 67<br />
kHz about 10.77 dB higher than that for a 2.2 m long bottlenose dolphin.<br />
5) Three-Layer Model To Extrapolate <strong>Target</strong> <strong>Strength</strong> Modeling <strong>of</strong> <strong>Killer</strong> <strong>Whales</strong> at 200 kHz<br />
Miller and Potter (2001) suggested the difference in TS estimates between gray and right whales was<br />
due to the difference in the thickness <strong>of</strong> their blubber layers. They also suggested an approach to estimate<br />
TS at other frequencies. Their method requires estimates <strong>of</strong> blubber thickness, its density and the speed<br />
and attenuation <strong>of</strong> sound through the blubber.<br />
The mathematic formula for three-layer reflection coefficients can be found in Medwin and Clay<br />
(1997), Miller and Potter (2001), and Brekhovskikh and Lysanov (2003). The TS <strong>of</strong> killer whales at<br />
higher frequencies such as 200 kHz can be estimated based on the plane wave reflection coefficient as a<br />
function <strong>of</strong> frequency for the elements <strong>of</strong> a three-layer model (skin, blubber layer, and lung) for a whale<br />
(Miller and Potter, 2001). Miller and Potter (2001) estimated the reflection coefficient for different<br />
thickness <strong>of</strong> blubber using a compressional sound speed <strong>of</strong> 1700 m/s, density <strong>of</strong> blubber <strong>of</strong> 1200 kg/m3,<br />
and attenuation <strong>of</strong> sound through blubber <strong>of</strong> 1 neper/m. In contrast, Jaffe et al. (2007) measured the<br />
attenuation <strong>of</strong> 100 kHz sound through sirenia (manatee) blubber to be about 5.57 dB/(10MHzmm),<br />
8
Code:46.2008-final-Feb9<br />
which equals 6.64 neper/m. For our analysis we chose to use values <strong>of</strong> <strong>of</strong> 4.45 neper/m at 67 kHz, 1.53<br />
neper/m at 23 kHz, and 13.28 neper/m at 200 kHz.<br />
The plane wave reflection coefficients for a three-layer model <strong>of</strong> water–blubber–lung at three different<br />
frequencies are shown in Figure 2 for an angle <strong>of</strong> incidence <strong>of</strong> 90 normal to the surface <strong>of</strong> the blubber. It<br />
also shows the variability in the reflection coefficient as a function <strong>of</strong> blubber thickness, which increases<br />
with frequency. Depending on the thickness <strong>of</strong> blubber layer, the difference in reflection coefficient<br />
between the frequencies <strong>of</strong> 67 kHz and 200 kHz could vary from 4 dB up to 15 dB. These reflection<br />
coefficient values can be used to estimate the TS <strong>of</strong> killer whales at 200 kHz.<br />
III.<br />
RESULTS<br />
A. Whale Behavior<br />
Figure 3 shows the averaged distance, depth, and swimming speed estimates for the killer whales<br />
observed a Lime Kiln Point. There were some unrealistic values for whale depth (above surface),<br />
possibly due uncertainty in the tilt angle <strong>of</strong> the split beam transducer in the horizontal direction or<br />
propagation effect such as multipath <strong>of</strong>f the ocean surface <strong>of</strong> the transmitter pulse and/or echo. Other than<br />
these observations, the trends in whale depth appear to be realistic given the visual observations <strong>of</strong> the<br />
whales. The whales were initially detected by the sonar at a range <strong>of</strong> about 100 m, swimming at a depth<br />
<strong>of</strong> about 2 or 3 m. They approached to within about 30 m from the sonar transducer at a depth <strong>of</strong> about 5<br />
m. At this range from the transducer they turned and swam away at a deeper depth. The killer whales<br />
were also observed to slow on their approach to the transducer then speed up after they turned and were<br />
swimming away from the transducer.<br />
9
Code:46.2008-final-Feb9<br />
B. <strong>Target</strong> <strong>Strength</strong><br />
Temperature and salinity were also measured by the <strong>BioSonics</strong> DT-X system and used to improve the<br />
accuracy <strong>of</strong> sound speed estimation. The resulting estimated speed <strong>of</strong> sound used in the echo ranging<br />
calculations was 1475.68 m/s. <strong>Killer</strong> whale TS was estimated using the echo sounder source level and the<br />
two-way transmission loss for 200 kHz sound in sea water. To improve the TS estimation, the relative<br />
angles between the sending acoustic beam axis and returning echo beam axis were used to compensate<br />
for the narrow beam effect by computing the composite beam pattern for the transmitting beam and the<br />
angle <strong>of</strong> arrival <strong>of</strong> the echo.<br />
During the 3-min the whales were observed by the sonar system (Figure 3), the whales initially<br />
approached the transducer at a fairly high swimming speed for about 20 s and then slowed and<br />
approached closer to the transducer over a 45 s period. In the final 20 s <strong>of</strong> observation, the whales turned<br />
from the transducer and swam away at higher speed until no longer detected by the sonar system. In each<br />
period (as annotated in Figure 1 with red color frames), the incident angles should have different<br />
statistics, because the aspect <strong>of</strong> insonification <strong>of</strong> the whales would have differed. During approach the<br />
whales would have been insonified at near head aspect; during their turn at a range <strong>of</strong> aspects from near<br />
head to broadside and finally near tail, and when swimming away at near tail aspect. For this reason, we<br />
analyzed the data in these three sections separately.<br />
Figures 4 illustrates the TS as a function as distance and time and provides histograms <strong>of</strong> TS data for<br />
each. In the first section, the averaged TS was −33 dB and the averaged speed was about 2.1 m/s. In the<br />
second section, the averaged TS was about −31 dB with an averaged speed <strong>of</strong> 1.6 m/s; it had highest TS<br />
measure <strong>of</strong> −4 dB. In the third section, the averaged TS was −23 dB with an averaged speed <strong>of</strong> 2.7 m/s.<br />
The three sections <strong>of</strong> observations where the whales were behaving differently and the aspect <strong>of</strong> the<br />
whale to the sonar system differed had different TS statistics. The first one looked like a central-weighted<br />
10
Code:46.2008-final-Feb9<br />
Gaussian distribution. The second one had a long tail at higher TS values. The TS in the third section has<br />
a bimodal distribution. The differences in the TS statistics for each segment are most likely due to the<br />
differences in the aspects at which the whales were insonified and the complexity <strong>of</strong> swimming whales as<br />
acoustic targets. The first segment had more TS measured at head aspect because the whales were<br />
approaching the transducer. In the second segment the whales presented more <strong>of</strong> a broadside aspect to the<br />
sonar system initially followed by more tail aspect. In the third segment the whales were at more <strong>of</strong> a tail<br />
aspect.<br />
In the next section we will consider in more detail the observed whale TS as a function <strong>of</strong> aspect to the<br />
insonifying acoustic beam.<br />
C. <strong>Target</strong> <strong>Strength</strong> As Function <strong>of</strong> Aspect Direction/<strong>Inc</strong>ident Angle<br />
Figure 5 shows histograms <strong>of</strong> the estimated TS and angle <strong>of</strong> incidence <strong>of</strong> the insonifying beams on the<br />
whales for the three observation segments. In each set <strong>of</strong> histograms the frequency <strong>of</strong> occurrence <strong>of</strong><br />
observed TS values are in the upper panel and histograms for the frequency <strong>of</strong> occurrence <strong>of</strong> estimated<br />
insonifying aspects are given in the lower panels.<br />
In the first set <strong>of</strong> histograms (Figure 5a-b) that correspond to the first observation segment where the<br />
whales were approaching the sonar transducer, most <strong>of</strong> the incident angles (lower panel) are less than<br />
100° (0 is head aspect, 90 is broadside aspect, 180 is tail aspect); there are few observations above<br />
100°. In the second set <strong>of</strong> histograms corresponding to the second observation segment (Figure 5c-d), the<br />
lower panel shows the incident angles spread across the entire range from head to tail aspect but with<br />
higher frequency <strong>of</strong> occurrence at broadside aspect (90). The third set <strong>of</strong> histograms for the third<br />
observation segment when the whales were moving away from the sonar transducer (Figure 5e-f), the<br />
incident angles are more frequent from broadside toward tail aspect. These estimates <strong>of</strong> the aspect <strong>of</strong><br />
11
Code:46.2008-final-Feb9<br />
insonifying beam incidence are consistent with our interpretation <strong>of</strong> whale motion based on analysis <strong>of</strong><br />
the change in range with time <strong>of</strong> echoes from the whales.<br />
D. <strong>Target</strong> <strong>Strength</strong> As Function <strong>of</strong> Aspect Angle<br />
The TS observations <strong>of</strong> three individual <strong>of</strong> killer whales as a function <strong>of</strong> the angle <strong>of</strong> incidence <strong>of</strong> the<br />
acoustic system beam are shown in the polar plots <strong>of</strong> Figure 6 for the three observation segments. In the<br />
first observation segment, most <strong>of</strong> the TS measurements are for head-on aspect because the whales were<br />
approaching the transducer. The TS observations for this segment vary from about −45 dB at an<br />
insonifying incident angle <strong>of</strong> 20° (near head) to −22 dB at an aspect angle <strong>of</strong> 80° (near broadside aspect)<br />
(Figure 6a). In the second observation segment (Figure 6b), the highest TS observations, about −10 dB,<br />
were at 90° incidence (broadside); however, there are also a few observations <strong>of</strong> high TS at 0° (head<br />
aspect) and 180° (tail aspect). In the third observation segment (Figure 6c), the TS measurements were<br />
primarily from incident angles larger than 90°, more toward tail aspect, as expected for whales that were<br />
moving away from the sonar system. The highest TS value observed was −7 dB at broadside aspect. The<br />
data also show a lobe in the directivity at about 110°, with TS values up to −13 dB. The lowest TS values<br />
observed were near −40 dB.<br />
E. <strong>Target</strong> <strong>Strength</strong> Modeling <strong>of</strong> <strong>Killer</strong> <strong>Whales</strong><br />
The TS directivity estimates at 67 kHz for killer whales along with the TS directivity for bottlenose<br />
dolphins measured by Au (1996) are shown in Figure 7. The estimated TS <strong>of</strong> killer whales is modeled on<br />
the measurements <strong>of</strong> bottlenose dolphin reported by Au (1996) with a 10.77 dB <strong>of</strong>fset to account for the<br />
difference in the size <strong>of</strong> the lungs in the two dolphin species. The TS <strong>of</strong> an adult killer whale 7.5 m in<br />
length at a frequency <strong>of</strong> 67 kHz is approximately −8 dB at the broadside aspect and −28 dB from the tailon<br />
aspect. This estimate is applicable for 7.5-m killer whales swimming close to the surface; however, the<br />
TS <strong>of</strong> aquatic mammals vary with water depth because <strong>of</strong> changes in lung volume with increasing<br />
12
Code:46.2008-final-Feb9<br />
pressure. The change in TS with depth could be estimated assuming that lung volume would decrease by<br />
50% for each doubling <strong>of</strong> hydrostatic pressure (Ridgeway and Howard, 1979).<br />
IV.<br />
DISCUSSION AND CONCLUSIONS<br />
Field measurement <strong>of</strong> the TS <strong>of</strong> marine mammals in general and large whales in particular is very<br />
difficult for many reasons. Data from the May 2008 deployment <strong>of</strong> a <strong>BioSonics</strong> 200 kHz active sonar<br />
system at Lime Kiln Point provided a unique opportunity to estimate the TS <strong>of</strong> killer whales. The<br />
analyses <strong>of</strong> these data provided estimates <strong>of</strong> killer whale TS over insonifying aspects from tail to head.<br />
The TS measurements obtained at 200 kHz <strong>of</strong> killer whale TS can be compared with TS estimates<br />
obtained using a preliminary three-layer model <strong>of</strong> acoustic reflectivity at 67 kHz.<br />
The <strong>Southern</strong> <strong>Resident</strong> killer whale preys on adult Chinook salmon in Puget Sound and elsewhere in<br />
the Pacific Ocean near the northwestern Pacific coast. <strong>Killer</strong> whales should develop a blubber layer but<br />
not as thick as that <strong>of</strong> right whales or even humpbacks. In terms <strong>of</strong> overall size, killer whales are<br />
relatively smaller than right whales (10.7 to 16.8 m long) and humpbacks (12.2 to 15.2 m long). Thus,<br />
assuming killer whale blubber thickness is about 0.1 m, approximately −10 dB must be added to the TS<br />
model <strong>of</strong> killer whales TS at 67 kHz. This adjustment to the 67 kHz estimate <strong>of</strong> TS directivity for killer<br />
whales would result in 200 kHz TS values ranging between −18 dB to −38 dB depending upon aspect<br />
angle. The TS estimates obtained so far are for a 7.5 m killer whale. However, the adult male killer<br />
whales can be as much as 10 m in length. Given our proportionality arguments we would expect the TS<br />
<strong>of</strong> larger killer whales to be as much as 3 dB higher than those for the smaller 7.5 m long whale. This<br />
would increase the range <strong>of</strong> TS for the larger killer whales to −15 dB to −35 dB. The measurement data<br />
for the free swimming killer whales at Lime Kiln from the first observation segment range from −22 dB<br />
to −45 dB where the whales were believed to be observed at near head on aspect. Measurement data from<br />
13
Code:46.2008-final-Feb9<br />
the second observation segment yielded TS values ranging from −10 dB to −48 dB over a range <strong>of</strong> aspect<br />
from head through broadside to tail. In observation segment three, TS observations ranged from −7 dB to<br />
−40 dB for retreating whales insonified at the tail aspect. These TS measurements are relatively<br />
comparable to the model for killer whales at 200 kHz, which predicts TS values within the range from<br />
−15 dB to −35 dB. To our knowledge, no other field measurements <strong>of</strong> killer whales TS have been<br />
reported in the literature.<br />
The target strength model <strong>of</strong> killer whale TS is based on TS measurement <strong>of</strong> a bottlenose dolphin at 67<br />
kHz and a three-layer reflection model used to extrapolate modeled killer whales TS values from 67 kHz<br />
to 200 kHz. The TS <strong>of</strong> an adult killer whale was modeled for an insonifying frequency <strong>of</strong> 67 kHz by<br />
assuming that a killer whale shares similar morphological structure with a bottlenose dolphin and that the<br />
ratio <strong>of</strong> lung length to total length is the same across dolphin species and sizes <strong>of</strong> animals within species.<br />
The TS <strong>of</strong> killer whales at higher frequencies - 200 kHz were modeled using a simplified three-layer<br />
model with correction based on the estimated differences in acoustic reflection coefficients as a function<br />
<strong>of</strong> blubber thickness at different frequencies. Interestingly, the averaged measurement data <strong>of</strong> three<br />
different Lime Kiln observation segments show that the TS <strong>of</strong> killer whales are in the range <strong>of</strong> −11 dB<br />
(broadside) to −43 dB (tail aspect). The modeling result gives range from −18 dB (broadside) to −38 dB<br />
(tail aspect) at 200 kHz frequency. Both the modeling and measurements TS results are surprisingly low.<br />
In Au’s 1996 measurement <strong>of</strong> the bottlenose dolphin, he found an unexpected decrease in TS at the<br />
broadside aspect as the frequency increased from 23 to 45 kHz. Au explained the TS decrease might be<br />
due to the anechoic properties <strong>of</strong> dolphin skin or blubber layer because, based on the formula provided in<br />
Urick (1983), the TS for most underwater objects increases or remains constant with frequency.<br />
However, the data used by Urick (1983) are mostly for simple geometric shapes <strong>of</strong> uniform composition<br />
and are assumed to have a large impedance difference from water. None <strong>of</strong> these assumptions hold for the<br />
14
Code:46.2008-final-Feb9<br />
body <strong>of</strong> whales, which are complex, composed <strong>of</strong> layers with very different physical and acoustic<br />
properties. Even when the three-layer model is simplified by not considering the skin and muscle, it<br />
might still provide a better estimate <strong>of</strong> acoustic reflectance than the two-layer model with large<br />
impedance mismatch used by Urick. These considerations might explain the unexpectedly low TS<br />
measurements Au’s 1996 obtained for bottlenose dolphin and might also help explain the relatively low<br />
killer whale at 200-kHz frequency.<br />
As with any other experiment, unavoidable measurement errors are always a factor affecting<br />
estimates. For example, the pulse length <strong>of</strong> the Biosonics DT-X system is 400 μs (user selectable from<br />
0.1 ms to 1.0 ms), which is likely too short to insonify an entire whale; this is most certainly the case<br />
when the whale is approaching or swimming away from the sonar. In that case, the TS <strong>of</strong> killer whale at<br />
tail or head aspects would be underestimated. The TS <strong>of</strong> an underwater object is likely to be less at short<br />
ranges than at long ranges. One reason is that a very directional active sonar signal fails to insonify the<br />
entire target. Another reason is the target reflection as echo usually acts differently from point source,<br />
depending on the size and shape <strong>of</strong> the underwater object.<br />
The trajectory <strong>of</strong> whale motion in Figure 1 and the whales’ speed as a function <strong>of</strong> time in Figure 3<br />
show that during the 3-min sonar observation period, the whales first were approaching the transducer for<br />
about 20 s and then moved closest to the transducer for about 45 s. In the final 20 s, the whales moved<br />
away with increased speed. Similar behavior was observed also in studies by both Love (1971) and<br />
Lucifredi and Stein (2007) with center frequencies <strong>of</strong> 20 kHz and 23 kHz for humpback whales and gray<br />
whales. They observed that the whales approached the transmit site, slowed down or even stopped to<br />
listen for a while, and then moved on with increased speed. It is generally considered safe to use<br />
echosounders at frequencies above 180 kHz in the vicinity <strong>of</strong> marine mammals because this is out <strong>of</strong> the<br />
hearing range <strong>of</strong> most marine mammals. However, the recent study <strong>of</strong> a signal leakage <strong>of</strong> active sonar<br />
15
Code:46.2008-final-Feb9<br />
systems (Deng et al., 2010) shows that a signal other than the primary signal at lower frequency could<br />
potentially fall into the hearing range <strong>of</strong> marine mammals (Southall et al., 2007), which is consistent with<br />
the observation in this case that the killer whales were capable <strong>of</strong> hearing the 200 kHz sonar because <strong>of</strong><br />
transmit signal spectral components at frequencies within the hearing range <strong>of</strong> killer whales.<br />
Acknowledgment<br />
The work described in this article was funded by The Wind and Water Power Program <strong>of</strong> the U.S.<br />
Department <strong>of</strong> Energy Office <strong>of</strong> Energy Efficiency and Renewable Energy. The study was conducted at<br />
Pacific Northwest National Laboratory (PNNL) in Richland, Washington, which is operated by Battelle<br />
for the U.S. Department <strong>of</strong> Energy. The authors thank Tim Acker <strong>of</strong> <strong>BioSonics</strong> <strong>Inc</strong>. for providing the<br />
original data. We also thank Charlie Brandt, Andrea Copping, Jayson Martinez, Graysen Squeochs, and<br />
Andrea Currie <strong>of</strong> PNNL, who provided comments and technical help in preparing the manuscript.<br />
16
Code:46.2008-final-Feb9<br />
References<br />
Au, W.W.L. 1996. Acoustic reflectivity <strong>of</strong> a dolphin. J. Acoust. Soc. Am. 39:3844–3848.<br />
<strong>BioSonics</strong>. 2008. BS&E-2008-04-0009-1.4- DT4 Data File Format Specification. <strong>BioSonics</strong>, <strong>Inc</strong>.,<br />
Seattle, Washington.<br />
Brekhovskikh, L. M., and Lysanov, Yu. P. 2003. Fundamentals <strong>of</strong> Ocean Acoustics, 3rd ed. Berlin:<br />
Springer. 278 pp.<br />
Carlson, T.J. and Jackson, D.R. 1980. Empirical evaluation <strong>of</strong> the feasability <strong>of</strong> split beam methods for<br />
direct in situ target strength measurement <strong>of</strong> single fish. Seattle Applied Physics Laboratory, University<br />
<strong>of</strong> Washington, 43 pp.<br />
Clay, C. S. 1991. Low-resolution acoustic scattering models: fluid-filled cylinders and fish with<br />
swimbladders. J. Acoust. Soc. Am. 89:2168–2179.<br />
Clay, C. S., and Horne, J. K. 1994. Acoustic models <strong>of</strong> fish: the Atlantic cod (Gadus morhua). J.<br />
Acoust. Soc. Am. vol. 96(3):1661–1668.<br />
Deng, Z. D., Weiland, M. A., Seim, T. A., LaMarche, B. L., Choi, E. Y., Fu, T., Carlson, T. J., and<br />
Eppard, M. B. 2011. A cabled acoustic telemetry system for detecting and tracking juvenile salmon:<br />
part 2. three-dimensional tracking and passage outcomes. Sensors 11(6):5661–5676.<br />
17
Code:46.2008-final-Feb9<br />
Deng, Z., M. A. Weiland, Fu, T., Seim, T. A., LaMarche, B. L., Choi, E. Y., Carlson, T. J., and Eppard,<br />
M. B. 2010. Design and instrumentation <strong>of</strong> a measurement and calibration system for an acoustic<br />
telemetry system. Sensors 10(4):3090–3099.<br />
Dunn, J. L. 1969. Airborne measurements <strong>of</strong> the acoustic characteristics <strong>of</strong> a sperm whale. J. Acoust.<br />
Soc. Am. 46: 1052–1054.<br />
Endangered Species Act <strong>of</strong> 1973. 7 U.S.C. Section 136, 16 U.S.C. Section 1531, et seq.<br />
Ehrenberg, J.E. 1974. Two applications for a dual-beam transducer in hydroacoustic fish assessment<br />
systems. Proceedings <strong>of</strong> the IEEE International Conference on Engineering in the Ocean Environment,<br />
21–23 August 1974, IEEE 1974, pp. 152–5.<br />
Foote, K. G. 1980. Rather-high-frequency sound scattering by swimbladdered fish. J. Acoust. Soc.<br />
Am. 78:688–700.<br />
Jaffe, J. S., Simonet, F., Roberts, P.L.D., and Bowles, A. E. 2007. Measurement <strong>of</strong> the acoustic<br />
reflectivity <strong>of</strong> sirenia (Florida manatees) at 171 kHz. J. Acoust. Soc. Am. 121:158–165.<br />
Kvadsheim, P., Benders, F., Miller, P., Doksæter, L., Knudsen, F., Tyack, P., Nordlund, N., Lam, F.-P.,<br />
Samarra, F., Kleivane, L., and Godø, O. R. 2007. Herring (sild), <strong>Killer</strong> <strong>Whales</strong> (spekkhogger) and<br />
Sonar – the 3S-2006 Cruise Report with Preliminary Results. FFI-rapport 2007/01189, Forsvarets<br />
forskningsinstitutt/Norwegian Defence Research Establishment (FFI), Horten, Norway.<br />
18
Code:46.2008-final-Feb9<br />
Levenson, C. 1974. Source level and bistatic target strength <strong>of</strong> the sperm whale (Physeter catadon)<br />
measured from an oceanographic aircraft. J. Acoust. Soc. Am. 55:1100–1103.<br />
Love, R. H. 1971. Dorsal-aspect target strength <strong>of</strong> an individual fish. J. Acoust. Soc. Am. (49):816–<br />
823.<br />
Lucifredi, I., and Stein, P. J. 2007. Gray whale target strength measurements and the analysis <strong>of</strong> the<br />
backscattered response. J. Acoust. Soc. Am. 121:1383–1391.<br />
Marine Mammal Protection Act <strong>of</strong> 1972.<br />
16 U.S.C. Sections 1361-1421h, October 21, 1972, as<br />
amended 1973, 1976-1978, 1980-1982, 1984, 1986, 1988, 1990, 1992-1994 and 1996.<br />
McMichael, G. A., Eppard, M. B., Carlson, T. J., Carter, J. A., Ebberts, B. D., Brown, R. S., Weiland,<br />
M., Ploskey, G. R., Harnish, R. A., and Deng, Z. D. 2010. The Juvenile Salmon Acoustic Telemetry<br />
System: a new tool. Fisheries 35(1):9–22.<br />
Medwin, H., and Clay, C. S. 1997. Fundamentals <strong>of</strong> Acoustical Oceanography. New York: Academic<br />
Press. 712 pp.<br />
Miller, J. H., and Potter, D. C. 2001. Active high frequency phased-array sonar for whale ship strike<br />
avoidance: target strength measurements. In: MTS/IEEE OCEANS 2001 – An Ocean Odyssey, vol. 4,<br />
pp. 2104–2107. Washington, D.C.: Marine Technology Society.<br />
19
Code:46.2008-final-Feb9<br />
Nøttestad, .L, and Axelsen, B. E. 1999. Herring schooling manoeuvres in response to killer whale<br />
attacks. Can. J. Zool. 77:1540–1546.<br />
Nøttestad, L., and Similä, T. 2001. <strong>Killer</strong> whales attacking schooling fish: why force herring from<br />
deep water to the surface? Mar. Mamm. Sci. 17:343–352.<br />
Nøttestad, L., Ferno, A., and Axelson, B. E. 2002b. Digging in the deep: killer whales’ advanced<br />
hunting tactic. Polar Biol. 25:939–941.<br />
Nøttestad. L., Ferno, A., Mackinson, S., Pitcher, T. J., and Misund, O. A. 2002a. How whales influence<br />
herring school dynamics in a cold front area <strong>of</strong> the Norwegian Sea. ICES J. Mar. Sci. 59:393–400.<br />
Proakis, J. G. 2000. Digital Communications, 4th ed. New York: McGraw-Hill. 1024 pp.<br />
Reeder, D. B., and Stanton, T. K. 2004. Acoustic scattering by axisymmetric finite-length bodies: an<br />
extension <strong>of</strong> a two-dimensional conformal mapping method. J. Acoust. Soc. Am. 116:729–746.<br />
Reeder, D. B., Jech, J. M., and Stanton, T. K. 2004. Broadband acoustic backscatter and highresolution<br />
morphology <strong>of</strong> fish: measurement and modeling. J. Acoust. Soc. Am. 116:747–761.<br />
Ridgeway, S. H., and Howard, R. 1979. Dolphin lung collapse and intramuscular circulation during<br />
free dive. Science 206:1182–1183.<br />
20
Code:46.2008-final-Feb9<br />
Similä, T. 1997. Sonar observations <strong>of</strong> killer whales (Orcinus orca) feeding on herring schools. Aquat.<br />
Mamm. 23(3):119–126.<br />
Southall, B. L., Bowles, A. E., Ellison, W. T., Finneran, J. J., Gentry, R. L., Greene Jr., C. R., Kastak,<br />
D., Ketten, D. R., Miller, J. H., Nachtigall, P. E., Richardson, W. J., Thomas, J. A., and Tyack, P. L.<br />
2007. Marine mammal noise exposure criteria: initial scientific recommendations. Aquat. Mamm.<br />
33(4):411–522.<br />
Szymanski, M. D., Bain, D. E., Kiehl, K., Pennington, S., Wong, S., and Henry, K. R. 1999. <strong>Killer</strong><br />
whale (Orcinus orca) hearing: auditory brainstem response and behavioral audiograms. J. Acoust. Soc.<br />
Am. 106:1134–1141.<br />
Urick, R. J. 1983. Principles <strong>of</strong> Underwater Sound for Engineers. New York: McGraw-Hill. 423 pp.<br />
Weiland, M. A., Deng, Z. D., Seim, T. A., LaMarche, B. L., Choi, E. Y., Fu, T., Carlson, T. J., Thronas,<br />
A. I., and Eppard, M. B. 2011. A cabled acoustic telemetry system for detecting and tracking juvenile<br />
salmon: part 1. engineering design and instrumentation. Sensors 11(6):5645–5660.<br />
21
Code:46.2008-final-Feb9<br />
List <strong>of</strong> Figures<br />
FIGURE 1<br />
Echogram acquired with a <strong>BioSonics</strong> split-beam DT-X system on May 22, 2008 at Lime Kiln State Park<br />
that shows three time periods containing echoes from killer whales.<br />
22
Code:46.2008-final-Feb9<br />
FIGURE 2<br />
Plane wave reflection coefficient as a function <strong>of</strong> blubber thickness for a three-layer model <strong>of</strong> water–<br />
blubber–lung at three frequencies: 23-kHz, 67-kHz, and 200-kHz.<br />
23
Code:46.2008-final-Feb9<br />
FIGURE 3<br />
The averaged distance from the sonar system transducer (a), swimming depth (b), and swimming speed<br />
(c) <strong>of</strong> three killer whales.<br />
24
Code:46.2008-final-Feb9<br />
FIGURE 4<br />
<strong>Target</strong> strengh estimates for three killer whales. The panels in the left column (a: Section 1; c: Section 2;<br />
e: Section 3) show target strength observations for a killer whale as a function <strong>of</strong> distance from the sonar<br />
system transducer and time. The panels in the right column (b: Section 1;d: Section 2; f: Section 3) show<br />
a histogram <strong>of</strong> the whale target strength estimates.<br />
25
Code:46.2008-final-Feb9<br />
26
Code:46.2008-final-Feb9<br />
FIGURE 5<br />
Histogram <strong>of</strong> the target strength (upper pannels) and acoustic beam incident angles (lower row panels)<br />
for the three observational segments when whales were observed approaching (5a-b), turning away from<br />
(5c-d), and retreating from the acoustic system transducer (5e-f).<br />
27
Code:46.2008-final-Feb9<br />
FIGURE 6<br />
<strong>Target</strong> strength <strong>of</strong> three killer whales as function <strong>of</strong> acoustic beam incident aspect angles. (a)<br />
Observation segment 1; (b) Obervation segment 2 ; (c) Observation segment 3.<br />
28
Code:46.2008-final-Feb9<br />
FIGURE 7<br />
Polar plot <strong>of</strong> the estimated target strength <strong>of</strong> killer whale at frequency <strong>of</strong> 67 kHz. The red curve is the<br />
target strength <strong>of</strong> bottle-nose dolphin measured by Au (1996).<br />
29