Digital scanning sonar for fish feeding monitoring in ... - BioSonics, Inc
Digital scanning sonar for fish feeding monitoring in ... - BioSonics, Inc
Digital scanning sonar for fish feeding monitoring in ... - BioSonics, Inc

Create successful ePaper yourself
Turn your PDF publications into a flip-book with our unique Google optimized e-Paper software.
transducer with very low side lobes and <strong>BioSonics</strong><br />
transducers have side lobes of less than –30 dB.<br />
The research prototype of FFM was built around<br />
the exist<strong>in</strong>g technology of the <strong>BioSonics</strong> DE Model<br />
200 kHz, 6 digital <strong>sonar</strong> system [1].<br />
Modifications to the digital <strong>sonar</strong> eng<strong>in</strong>e (both<br />
hardware and software <strong>for</strong> data acquisition) were<br />
necessary to accommodate the <strong>scann<strong>in</strong>g</strong><br />
rotator/transducer assembly. Data file <strong>for</strong> each p<strong>in</strong>g<br />
are stored on the operat<strong>in</strong>g computer hard drive.<br />
Data files conta<strong>in</strong> general <strong>in</strong><strong>for</strong>mation about <strong>sonar</strong><br />
system parameters (e.g. frequency, beamwidth,<br />
transmitted power, receiver sensitivity, pulse<br />
length, threshold etc.), <strong>in</strong><strong>for</strong>mation <strong>for</strong> each<br />
<strong>in</strong>dividual p<strong>in</strong>g <strong>in</strong> a <strong>for</strong>m of echo envelope<br />
amplitude (digitized at a frequency of 41.33 kHz),<br />
digitized phase <strong>in</strong><strong>for</strong>mation of an echo signal (<strong>in</strong><br />
split-beam mode), and rotator motor orientation.<br />
The FFM also <strong>in</strong>corporates <strong>in</strong><strong>for</strong>mation from a<br />
current meter (Falmouth Model ACM-CBP-S, two<br />
component digital Doppler current meter) with<br />
compass.<br />
Several modules of the FFM system were<br />
designed, developed and implemented specifically<br />
<strong>for</strong> this project. These are as follows:<br />
• Scann<strong>in</strong>g Rotator allow<strong>in</strong>g changes to pan and<br />
tilt angle of transducer,<br />
• Rotator Motor drivers and Power Supply,<br />
• Software <strong>for</strong> <strong>scann<strong>in</strong>g</strong> rotator motor control<br />
“BioScan”,<br />
• Lost pellet detection software: “BioMonitor”<br />
with Plane Position Indicator (PPI) of detected<br />
pellets, and lost pellet counter.<br />
3.1. Rotator and Scann<strong>in</strong>g Software (BioScan)<br />
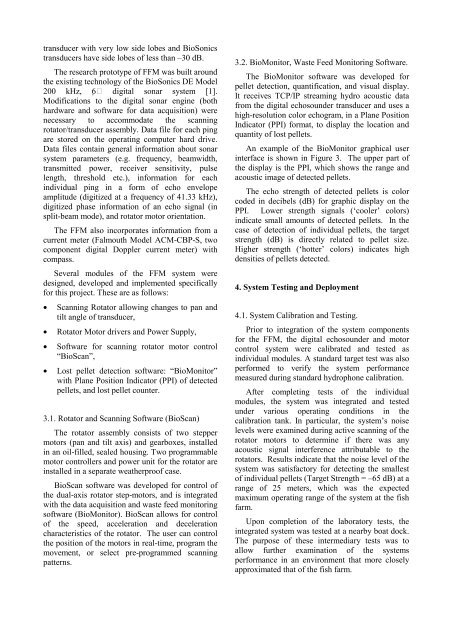
The rotator assembly consists of two stepper<br />
motors (pan and tilt axis) and gearboxes, <strong>in</strong>stalled<br />
<strong>in</strong> an oil-filled, sealed hous<strong>in</strong>g. Two programmable<br />
motor controllers and power unit <strong>for</strong> the rotator are<br />
<strong>in</strong>stalled <strong>in</strong> a separate weatherproof case.<br />
BioScan software was developed <strong>for</strong> control of<br />
the dual-axis rotator step-motors, and is <strong>in</strong>tegrated<br />
with the data acquisition and waste feed <strong>monitor<strong>in</strong>g</strong><br />
software (BioMonitor). BioScan allows <strong>for</strong> control<br />
of the speed, acceleration and deceleration<br />
characteristics of the rotator. The user can control<br />
the position of the motors <strong>in</strong> real-time, program the<br />
movement, or select pre-programmed <strong>scann<strong>in</strong>g</strong><br />
patterns.<br />
3.2. BioMonitor, Waste Feed Monitor<strong>in</strong>g Software.<br />
The BioMonitor software was developed <strong>for</strong><br />
pellet detection, quantification, and visual display.<br />
It receives TCP/IP stream<strong>in</strong>g hydro acoustic data<br />
from the digital echosounder transducer and uses a<br />
high-resolution color echogram, <strong>in</strong> a Plane Position<br />
Indicator (PPI) <strong>for</strong>mat, to display the location and<br />
quantity of lost pellets.<br />
An example of the BioMonitor graphical user<br />
<strong>in</strong>terface is shown <strong>in</strong> Figure 3. The upper part of<br />
the display is the PPI, which shows the range and<br />
acoustic image of detected pellets.<br />
The echo strength of detected pellets is color<br />
coded <strong>in</strong> decibels (dB) <strong>for</strong> graphic display on the<br />
PPI. Lower strength signals (‘cooler’ colors)<br />
<strong>in</strong>dicate small amounts of detected pellets. In the<br />
case of detection of <strong>in</strong>dividual pellets, the target<br />
strength (dB) is directly related to pellet size.<br />
Higher strength (‘hotter’ colors) <strong>in</strong>dicates high<br />
densities of pellets detected.<br />
4. System Test<strong>in</strong>g and Deployment<br />
4.1. System Calibration and Test<strong>in</strong>g.<br />
Prior to <strong>in</strong>tegration of the system components<br />
<strong>for</strong> the FFM, the digital echosounder and motor<br />
control system were calibrated and tested as<br />
<strong>in</strong>dividual modules. A standard target test was also<br />
per<strong>for</strong>med to verify the system per<strong>for</strong>mance<br />
measured dur<strong>in</strong>g standard hydrophone calibration.<br />
After complet<strong>in</strong>g tests of the <strong>in</strong>dividual<br />
modules, the system was <strong>in</strong>tegrated and tested<br />
under various operat<strong>in</strong>g conditions <strong>in</strong> the<br />
calibration tank. In particular, the system’s noise<br />
levels were exam<strong>in</strong>ed dur<strong>in</strong>g active <strong>scann<strong>in</strong>g</strong> of the<br />
rotator motors to determ<strong>in</strong>e if there was any<br />
acoustic signal <strong>in</strong>terference attributable to the<br />
rotators. Results <strong>in</strong>dicate that the noise level of the<br />
system was satisfactory <strong>for</strong> detect<strong>in</strong>g the smallest<br />
of <strong>in</strong>dividual pellets (Target Strength = –65 dB) at a<br />
range of 25 meters, which was the expected<br />
maximum operat<strong>in</strong>g range of the system at the <strong>fish</strong><br />
farm.<br />
Upon completion of the laboratory tests, the<br />
<strong>in</strong>tegrated system was tested at a nearby boat dock.<br />
The purpose of these <strong>in</strong>termediary tests was to<br />
allow further exam<strong>in</strong>ation of the systems<br />
per<strong>for</strong>mance <strong>in</strong> an environment that more closely<br />
approximated that of the <strong>fish</strong> farm.