Bottom Classification - BioSonics, Inc
Bottom Classification - BioSonics, Inc
Bottom Classification - BioSonics, Inc

You also want an ePaper? Increase the reach of your titles
YUMPU automatically turns print PDFs into web optimized ePapers that Google loves.
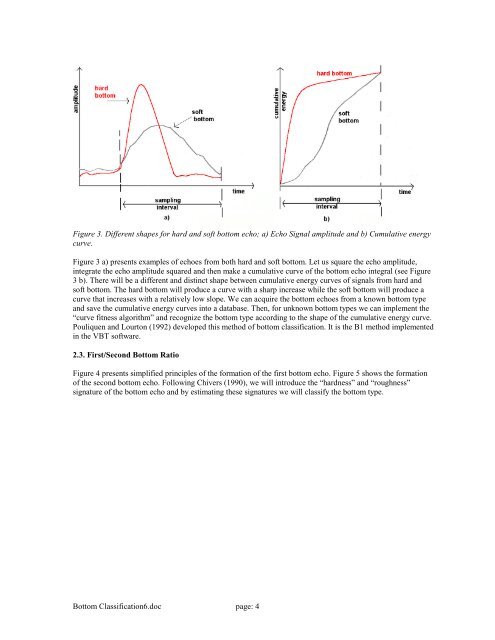
Figure 3. Different shapes for hard and soft bottom echo; a) Echo Signal amplitude and b) Cumulative energy<br />
curve.<br />
Figure 3 a) presents examples of echoes from both hard and soft bottom. Let us square the echo amplitude,<br />
integrate the echo amplitude squared and then make a cumulative curve of the bottom echo integral (see Figure<br />
3 b). There will be a different and distinct shape between cumulative energy curves of signals from hard and<br />
soft bottom. The hard bottom will produce a curve with a sharp increase while the soft bottom will produce a<br />
curve that increases with a relatively low slope. We can acquire the bottom echoes from a known bottom type<br />
and save the cumulative energy curves into a database. Then, for unknown bottom types we can implement the<br />
“curve fitness algorithm” and recognize the bottom type according to the shape of the cumulative energy curve.<br />
Pouliquen and Lourton (1992) developed this method of bottom classification. It is the B1 method implemented<br />
in the VBT software.<br />
2.3. First/Second <strong>Bottom</strong> Ratio<br />
Figure 4 presents simplified principles of the formation of the first bottom echo. Figure 5 shows the formation<br />
of the second bottom echo. Following Chivers (1990), we will introduce the “hardness” and “roughness”<br />
signature of the bottom echo and by estimating these signatures we will classify the bottom type.<br />
<strong>Bottom</strong> <strong>Classification</strong>6.doc page: 4