Mathematics Programme of Learning - VincyClassroom
Mathematics Programme of Learning - VincyClassroom
Mathematics Programme of Learning - VincyClassroom

You also want an ePaper? Increase the reach of your titles
YUMPU automatically turns print PDFs into web optimized ePapers that Google loves.
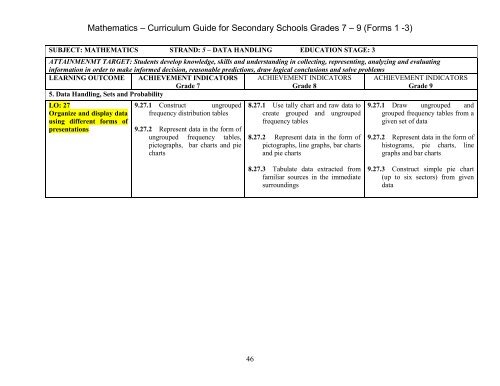
<strong>Mathematics</strong> – Curriculum Guide for Secondary Schools Grades 7 – 9 (Forms 1 -3)<br />
SUBJECT: MATHEMATICS STRAND: 5 – DATA HANDLING EDUCATION STAGE: 3<br />
ATTAINMENMT TARGET: Students develop knowledge, skills and understanding in collecting, representing, analyzing and evaluating<br />
information in order to make informed decision, reasonable predictions, draw logical conclusions and solve problems<br />
LEARNING OUTCOME ACHIEVEMENT INDICATORS<br />
Grade 7<br />
ACHIEVEMENT INDICATORS<br />
Grade 8<br />
ACHIEVEMENT INDICATORS<br />
Grade 9<br />
5. Data Handling, Sets and Probability<br />
LO: 27<br />
Organize and display data<br />
using different forms <strong>of</strong><br />
presentations<br />
9.27.1 Construct ungrouped<br />
frequency distribution tables<br />
9.27.2 Represent data in the form <strong>of</strong><br />
ungrouped frequency tables,<br />
pictographs, bar charts and pie<br />
charts<br />
8.27.1 Use tally chart and raw data to<br />
create grouped and ungrouped<br />
frequency tables<br />
8.27.2 Represent data in the form <strong>of</strong><br />
pictographs, line graphs, bar charts<br />
and pie charts<br />
9.27.1 Draw ungrouped and<br />
grouped frequency tables from a<br />
given set <strong>of</strong> data<br />
9.27.2 Represent data in the form <strong>of</strong><br />
histograms, pie charts, line<br />
graphs and bar charts<br />
8.27.3 Tabulate data extracted from<br />
familiar sources in the immediate<br />
surroundings<br />
9.27.3 Construct simple pie chart<br />
(up to six sectors) from given<br />
data<br />
46