Mathematics Programme of Learning - VincyClassroom
Mathematics Programme of Learning - VincyClassroom
Mathematics Programme of Learning - VincyClassroom

Create successful ePaper yourself
Turn your PDF publications into a flip-book with our unique Google optimized e-Paper software.
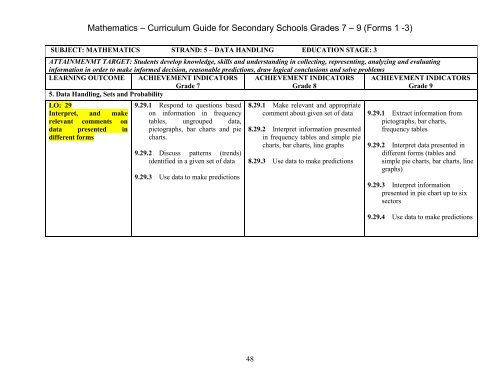
<strong>Mathematics</strong> – Curriculum Guide for Secondary Schools Grades 7 – 9 (Forms 1 -3)<br />
SUBJECT: MATHEMATICS STRAND: 5 – DATA HANDLING EDUCATION STAGE: 3<br />
ATTAINMENMT TARGET: Students develop knowledge, skills and understanding in collecting, representing, analyzing and evaluating<br />
information in order to make informed decision, reasonable predictions, draw logical conclusions and solve problems<br />
LEARNING OUTCOME ACHIEVEMENT INDICATORS<br />
Grade 7<br />
ACHIEVEMENT INDICATORS<br />
Grade 8<br />
ACHIEVEMENT INDICATORS<br />
Grade 9<br />
5. Data Handling, Sets and Probability<br />
LO: 29<br />
Interpret, and make<br />
relevant comments on<br />
data presented in<br />
different forms<br />
9.29.1 Respond to questions based<br />
on information in frequency<br />
tables, ungrouped data,<br />
pictographs, bar charts and pie<br />
charts.<br />
9.29.2 Discuss patterns (trends)<br />
identified in a given set <strong>of</strong> data<br />
9.29.3 Use data to make predictions<br />
8.29.1 Make relevant and appropriate<br />
comment about given set <strong>of</strong> data<br />
8.29.2 Interpret information presented<br />
in frequency tables and simple pie<br />
charts, bar charts, line graphs<br />
8.29.3 Use data to make predictions<br />
9.29.1 Extract information from<br />
pictographs, bar charts,<br />
frequency tables<br />
9.29.2 Interpret data presented in<br />
different forms (tables and<br />
simple pie charts, bar charts, line<br />
graphs)<br />
9.29.3 Interpret information<br />
presented in pie chart up to six<br />
sectors<br />
9.29.4 Use data to make predictions<br />
48