

2008 Annual Monitoring Report (pdf 10.9MB) - Bolsa Chica ...
2008 Annual Monitoring Report (pdf 10.9MB) - Bolsa Chica ...
2008 Annual Monitoring Report (pdf 10.9MB) - Bolsa Chica ...

You also want an ePaper? Increase the reach of your titles
YUMPU automatically turns print PDFs into web optimized ePapers that Google loves.
<strong>Bolsa</strong> <strong>Chica</strong> Lowlands Restoration <strong>Monitoring</strong><br />
<strong>2008</strong> <strong>Annual</strong> <strong>Report</strong><br />
settlement of the East MTB water control structure (WCS) on which the FTB tide gauge is mounted.<br />
As this structure settled downward, it suggested a rising water elevation in the FTB and thus the<br />
subtracted difference from LAOH tide station data would indicate negative values. This artifact in the<br />
data is an order of magnitude less important than the measured muting rates within the FTB, but it is<br />
important to understanding sources of tidal measurement error at the site.<br />
The overall differences in the high tide elevations are relatively small as shown in Table 2-2, with a<br />
2007-<strong>2008</strong> average difference of less than 0.007m. Given the anticipated settlement of WCSs, and thus<br />
the attached FTB gauge and the relatively minor variation from LAOH it is clear that no consequential<br />
muting of the high tides within the FTB has occurred.<br />
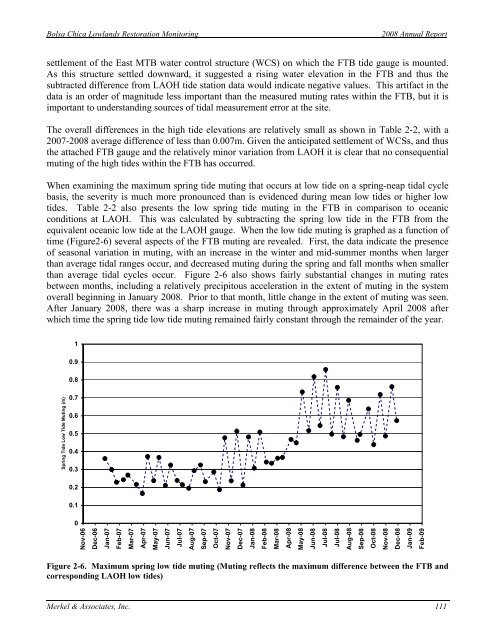
When examining the maximum spring tide muting that occurs at low tide on a spring-neap tidal cycle<br />
basis, the severity is much more pronounced than is evidenced during mean low tides or higher low<br />
tides. Table 2-2 also presents the low spring tide muting in the FTB in comparison to oceanic<br />
conditions at LAOH. This was calculated by subtracting the spring low tide in the FTB from the<br />
equivalent oceanic low tide at the LAOH gauge. When the low tide muting is graphed as a function of<br />
time (Figure2-6) several aspects of the FTB muting are revealed. First, the data indicate the presence<br />
of seasonal variation in muting, with an increase in the winter and mid-summer months when larger<br />
than average tidal ranges occur, and decreased muting during the spring and fall months when smaller<br />
than average tidal cycles occur. Figure 2-6 also shows fairly substantial changes in muting rates<br />
between months, including a relatively precipitous acceleration in the extent of muting in the system<br />
overall beginning in January <strong>2008</strong>. Prior to that month, little change in the extent of muting was seen.<br />
After January <strong>2008</strong>, there was a sharp increase in muting through approximately April <strong>2008</strong> after<br />
which time the spring tide low tide muting remained fairly constant through the remainder of the year.<br />
1<br />
0.9<br />
0.8<br />
Spring Tide Low Tide Muting (m)<br />
0.7<br />
0.6<br />
0.5<br />
0.4<br />
0.3<br />
0.2<br />
0.1<br />
0<br />
Nov-06<br />
Dec-06<br />
Jan-07<br />
Feb-07<br />
Mar-07<br />
Apr-07<br />
May-07<br />
Jun-07<br />
Jul-07<br />
Aug-07<br />
Sep-07<br />
Oct-07<br />
Nov-07<br />
Dec-07<br />
Jan-08<br />
Feb-08<br />
Mar-08<br />
Apr-08<br />
May-08<br />
Jun-08<br />
Jul-08<br />
Jul-08<br />
Aug-08<br />
Sep-08<br />
Oct-08<br />
Nov-08<br />
Dec-08<br />
Jan-09<br />
Feb-09<br />
Figure 2-6. Maximum spring low tide muting (Muting reflects the maximum difference between the FTB and<br />
corresponding LAOH low tides)<br />
Merkel & Associates, Inc. 111


