

2008 Annual Monitoring Report (pdf 10.9MB) - Bolsa Chica ...
2008 Annual Monitoring Report (pdf 10.9MB) - Bolsa Chica ...
2008 Annual Monitoring Report (pdf 10.9MB) - Bolsa Chica ...

Create successful ePaper yourself
Turn your PDF publications into a flip-book with our unique Google optimized e-Paper software.
<strong>Bolsa</strong> <strong>Chica</strong> Lowlands Restoration <strong>Monitoring</strong><br />
<strong>2008</strong> <strong>Annual</strong> <strong>Report</strong><br />
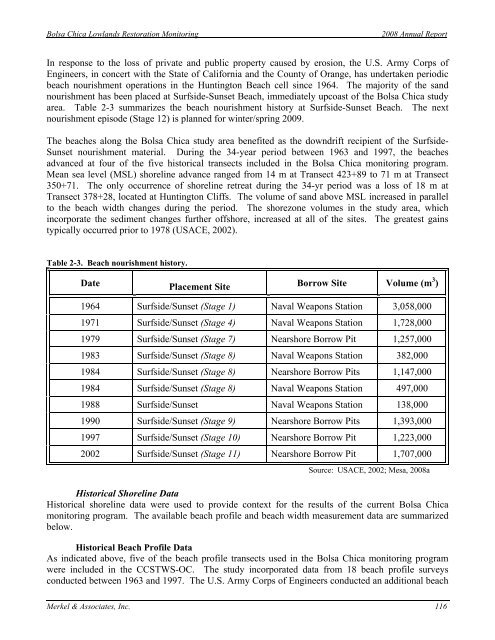
In response to the loss of private and public property caused by erosion, the U.S. Army Corps of<br />
Engineers, in concert with the State of California and the County of Orange, has undertaken periodic<br />
beach nourishment operations in the Huntington Beach cell since 1964. The majority of the sand<br />
nourishment has been placed at Surfside-Sunset Beach, immediately upcoast of the <strong>Bolsa</strong> <strong>Chica</strong> study<br />
area. Table 2-3 summarizes the beach nourishment history at Surfside-Sunset Beach. The next<br />
nourishment episode (Stage 12) is planned for winter/spring 2009.<br />
The beaches along the <strong>Bolsa</strong> <strong>Chica</strong> study area benefited as the downdrift recipient of the Surfside-<br />
Sunset nourishment material. During the 34-year period between 1963 and 1997, the beaches<br />
advanced at four of the five historical transects included in the <strong>Bolsa</strong> <strong>Chica</strong> monitoring program.<br />
Mean sea level (MSL) shoreline advance ranged from 14 m at Transect 423+89 to 71 m at Transect<br />
350+71. The only occurrence of shoreline retreat during the 34-yr period was a loss of 18 m at<br />
Transect 378+28, located at Huntington Cliffs. The volume of sand above MSL increased in parallel<br />
to the beach width changes during the period. The shorezone volumes in the study area, which<br />
incorporate the sediment changes further offshore, increased at all of the sites. The greatest gains<br />
typically occurred prior to 1978 (USACE, 2002).<br />
Table 2-3. Beach nourishment history.<br />
Date Placement Site Borrow Site Volume (m 3 )<br />
1964 Surfside/Sunset (Stage 1) Naval Weapons Station 3,058,000<br />
1971 Surfside/Sunset (Stage 4) Naval Weapons Station 1,728,000<br />
1979 Surfside/Sunset (Stage 7) Nearshore Borrow Pit 1,257,000<br />
1983 Surfside/Sunset (Stage 8) Naval Weapons Station 382,000<br />
1984 Surfside/Sunset (Stage 8) Nearshore Borrow Pits 1,147,000<br />
1984 Surfside/Sunset (Stage 8) Naval Weapons Station 497,000<br />
1988 Surfside/Sunset Naval Weapons Station 138,000<br />
1990 Surfside/Sunset (Stage 9) Nearshore Borrow Pits 1,393,000<br />
1997 Surfside/Sunset (Stage 10) Nearshore Borrow Pit 1,223,000<br />
2002 Surfside/Sunset (Stage 11) Nearshore Borrow Pit 1,707,000<br />
Source: USACE, 2002; Mesa, <strong>2008</strong>a<br />
Historical Shoreline Data<br />
Historical shoreline data were used to provide context for the results of the current <strong>Bolsa</strong> <strong>Chica</strong><br />
monitoring program. The available beach profile and beach width measurement data are summarized<br />
below.<br />
Historical Beach Profile Data<br />
As indicated above, five of the beach profile transects used in the <strong>Bolsa</strong> <strong>Chica</strong> monitoring program<br />
were included in the CCSTWS-OC. The study incorporated data from 18 beach profile surveys<br />
conducted between 1963 and 1997. The U.S. Army Corps of Engineers conducted an additional beach<br />
Merkel & Associates, Inc. 116


