- Page 1 and 2: CITY OF SUNNYVALE Draft DRAFT CLIMA
- Page 3 and 4: Draft
- Page 5 and 6: Draft
- Page 7 and 8: TABLE OF CONTENTS Horizon 2035 Advi
- Page 9 and 10: TABLE OF CONTENTS GHG Reduction Sum
- Page 11 and 12: TABLE OF CONTENTS Figure 3 - Potent
- Page 13 and 14: Draft
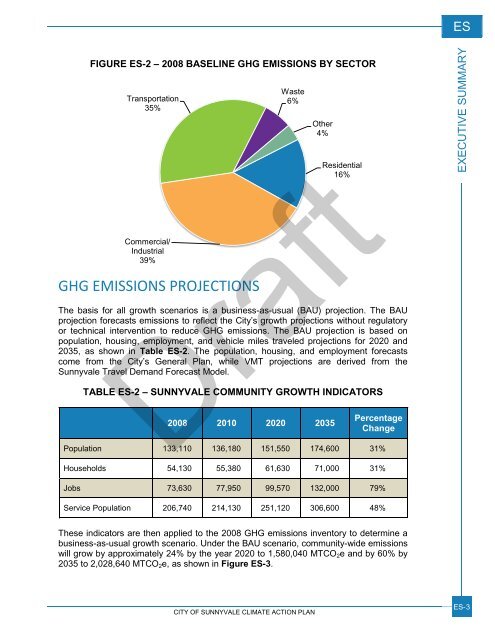
- Page 15: ES EXECUTIVE SUMMARY Planning Proce
- Page 19 and 20: ES EXECUTIVE SUMMARY reductions nec
- Page 21 and 22: ES EXECUTIVE SUMMARY ADAPTATION Eve
- Page 23 and 24: Draft CHAPTER 1 INTRODUCTION Local
- Page 25 and 26: 1 INTRODUCTION Local governments pl
- Page 27 and 28: 1 Local Climate Protection Efforts
- Page 29 and 30: 1 Additional Existing Climate Prote
- Page 31 and 32: 1 CLIMATE CHANGE SCIENCE In order t
- Page 33 and 34: 1 scientific basis of climate chang
- Page 35 and 36: 1 Several potential hydrological ch
- Page 37 and 38: 1 Federal agencies have undertaken
- Page 39 and 40: 1 Governor’s Executive Order S-3-
- Page 41 and 42: 1 requirements for a Qualified GHG
- Page 43 and 44: Draft
- Page 45 and 46: 2 GREENHOUSE GAS INVENTORY & FORECA
- Page 47 and 48: 2 GREENHOUSE GAS INVENTORY & FORECA
- Page 49 and 50: 2 GREENHOUSE GAS INVENTORY & FORECA
- Page 51 and 52: 2 GREENHOUSE GAS INVENTORY & FORECA
- Page 53 and 54: 2 GREENHOUSE GAS INVENTORY & FORECA
- Page 55 and 56: Draft
- Page 57 and 58: 3 GHG EMISSIONS REDUCTION STRATEGIE
- Page 59 and 60: 3 GHG EMISSIONS REDUCTION STRATEGIE
- Page 61 and 62: 3 GHG EMISSIONS REDUCTION STRATEGIE
- Page 63 and 64: 3 GHG EMISSIONS REDUCTION STRATEGIE
- Page 65 and 66: 3 GHG EMISSIONS REDUCTION STRATEGIE
- Page 67 and 68:
3 GHG EMISSIONS REDUCTION STRATEGIE
- Page 69 and 70:
3 GHG EMISSIONS REDUCTION STRATEGIE
- Page 71 and 72:
3 GHG EMISSIONS REDUCTION STRATEGIE
- Page 73 and 74:
3 GHG EMISSIONS REDUCTION STRATEGIE
- Page 75 and 76:
3 GHG EMISSIONS REDUCTION STRATEGIE
- Page 77 and 78:
3 GHG EMISSIONS REDUCTION STRATEGIE
- Page 79 and 80:
3 GHG EMISSIONS REDUCTION STRATEGIE
- Page 81 and 82:
3 GHG EMISSIONS REDUCTION STRATEGIE
- Page 83 and 84:
3 GHG EMISSIONS REDUCTION STRATEGIE
- Page 85 and 86:
3 GHG EMISSIONS REDUCTION STRATEGIE
- Page 87 and 88:
3 GHG EMISSIONS REDUCTION STRATEGIE
- Page 89 and 90:
3 GHG EMISSIONS REDUCTION STRATEGIE
- Page 91 and 92:
3 GHG EMISSIONS REDUCTION STRATEGIE
- Page 93 and 94:
Draft
- Page 95 and 96:
4 ADAPTATION FIGURE 18 - CALIFORNIA
- Page 97 and 98:
4 FIGURE 19 - SOUTH BAY REGION AT R
- Page 99 and 100:
4 ADAPTATION Adaptation Assistance
- Page 101 and 102:
4 FIGURE 21 - ASSESSING ADAPTATION
- Page 103 and 104:
Draft CHAPTER 5 IMPLEMENTATION PROG
- Page 105 and 106:
5 IMPLEMENTATION PROGRAM Reducing G
- Page 107 and 108:
5 • Performance Indicator: Perfor
- Page 109 and 110:
5 # Policy Topic Reduction Measure
- Page 111 and 112:
5 # Policy Topic Reduction Measure
- Page 113 and 114:
5 # Policy Topic Reduction Measure
- Page 115 and 116:
5 # Policy Topic Reduction Measure
- Page 117 and 118:
Draft
- Page 119 and 120:
6 GLOSSARY California Green Buildin
- Page 121 and 122:
6 GLOSSARY the legislative body of
- Page 123 and 124:
6 GLOSSARY Greenhouse Gas or Greenh
- Page 125 and 126:
6 Property Assessed Clean Energy (P
- Page 127 and 128:
6 GLOSSARY Transportation Demand Ma
- Page 129 and 130:
Draft APPENDIX A GHG INVENTORY METH
- Page 131 and 132:
A BASELINE GREENHOUSE GAS EMISSIONS
- Page 133 and 134:
A Overview of Calculation Methodolo
- Page 135 and 136:
A Review of similar inventories, in
- Page 137 and 138:
A FIGURE A-2- EMISSIONS BY SCOPE AN
- Page 139 and 140:
A FIGURE A-3 - BUILT-ENVIRONMENT GH
- Page 141 and 142:
A FIGURE A-5 - WASTE EMISSIONS BY S
- Page 143 and 144:
A FIGURE A-7 - OFF-ROAD EMISSIONS B
- Page 145 and 146:
Draft APPENDIX B GHG TECHNICAL APPE
- Page 147 and 148:
B CLIMATE ACTION PLAN TECHNICAL APP
- Page 149 and 150:
B OS-3 Action Items: - GHG Reductio
- Page 151 and 152:
B EC-1 Methodology: Total emissions
- Page 153 and 154:
B EC-2 New Construction and Remodel
- Page 155 and 156:
B EC-3 Residential Energy Efficienc
- Page 157 and 158:
B EC-4 http://pacenow.org/documents
- Page 159 and 160:
B EC-5 Sources: California Energy C
- Page 161 and 162:
B In addition to behavioral changes
- Page 163 and 164:
B Performance Indicators: All new p
- Page 165 and 166:
B Costs and Savings: City Costs: Ci
- Page 167 and 168:
B Performance Indicators: Residenti
- Page 169 and 170:
B GHG Assumptions: Percentage of de
- Page 171 and 172:
B LW-1 Costs and Savings: City Cost
- Page 173 and 174:
B GHG Assumptions: 2010 2020 2035 D
- Page 175 and 176:
B OR-2 Costs and Savings: City Cost
- Page 177 and 178:
B CA-1 Methodology: Reducing maximu
- Page 179 and 180:
B CA-2 School Education and Involve
- Page 181 and 182:
B Performance Indicators: Percentag
- Page 183 and 184:
B LUP-3 Sources: California Air Pol
- Page 185 and 186:
B LUP-5 Costs and Savings: City Cos
- Page 187 and 188:
B Action Items: CTO-1.1. Incorporat
- Page 189 and 190:
B CTO-2 Bicycle, Pedestrian, and Tr
- Page 191 and 192:
B CTO-3.5. Partner with GreenTRIP a
- Page 193 and 194:
B Costs and Savings: City Costs: Ci
- Page 195 and 196:
B OVT-1 Clean Alternative Motor Veh
- Page 197 and 198:
B OVT-2 Car Sharing Promote the use
- Page 199 and 200:
B Costs and Savings: City Costs: Ci
- Page 201 and 202:
B Methodology: N/A Sources: N/A A-3
- Page 203 and 204:
Draft APPENDIX C BAAQMD COMPLIANCE
- Page 205 and 206:
C BAAQMD COMPLIANCE The City of Sun
- Page 207 and 208:
C FIGURE C-1 - 2008 BASELINE GHG EM
- Page 209 and 210:
C Sector Source 2008 Baseline Indus
- Page 211 and 212:
C FIGURE C-3 - GREENHOUSE GAS EMISS
- Page 213 and 214:
C FIGURE C-4 - 2020 EMISSIONS REDUC
- Page 215 and 216:
C IMPLEMENTATION AND MONITORING To
- Page 217 and 218:
Draft APPENDIX D WORKS CITED
- Page 219 and 220:
D WORKS CITED Akbari, Hashem. 2005.
- Page 221 and 222:
D Ehrhardt-Martinez, K., K. Donnely