

DRAFT Climate Action Plan - PMC
DRAFT Climate Action Plan - PMC
DRAFT Climate Action Plan - PMC

Create successful ePaper yourself
Turn your PDF publications into a flip-book with our unique Google optimized e-Paper software.
2<br />
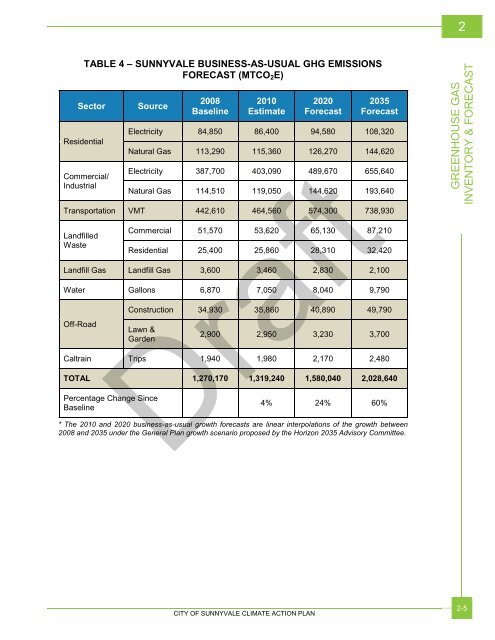
TABLE 4 – SUNNYVALE BUSINESS-AS-USUAL GHG EMISSIONS<br />
FORECAST (MTCO 2 E)<br />
Sector<br />
Residential<br />
Commercial/<br />
Industrial<br />
Source<br />
2008<br />
Baseline<br />
2010<br />
Estimate<br />
2020<br />
Forecast<br />
2035<br />
Forecast<br />
Electricity 84,850 86,400 94,580 108,320<br />
Natural Gas 113,290 115,360 126,270 144,620<br />
Electricity 387,700 403,090 489,670 655,640<br />
Natural Gas 114,510 119,050 144,620 193,640<br />
Transportation VMT 442,610 464,560 574,300 738,930<br />
Landfilled<br />
Waste<br />
Commercial 51,570 53,620 65,130 87,210<br />
Residential 25,400 25,860 28,310 32,420<br />
Landfill Gas Landfill Gas 3,600 3,460 2,830 2,100<br />
Water Gallons 6,870 7,050 8,040 9,790<br />
Off-Road<br />
Construction 34,930 35,860 40,890 49,790<br />
Lawn &<br />
Garden<br />
2,900 2,950 3,230 3,700<br />
Caltrain Trips 1,940 1,980 2,170 2,480<br />
TOTAL 1,270,170 1,319,240 1,580,040 2,028,640<br />
Percentage Change Since<br />
Baseline<br />
Draft<br />
4% 24% 60%<br />
* The 2010 and 2020 business-as-usual growth forecasts are linear interpolations of the growth between<br />
2008 and 2035 under the General <strong>Plan</strong> growth scenario proposed by the Horizon 2035 Advisory Committee.<br />
GREENHOUSE GAS<br />
INVENTORY & FORECAST<br />
CITY OF SUNNYVALE CLIMATE ACTION PLAN<br />
2-5