Download PDF - Keppel Land
Download PDF - Keppel Land
Download PDF - Keppel Land

Create successful ePaper yourself
Turn your PDF publications into a flip-book with our unique Google optimized e-Paper software.
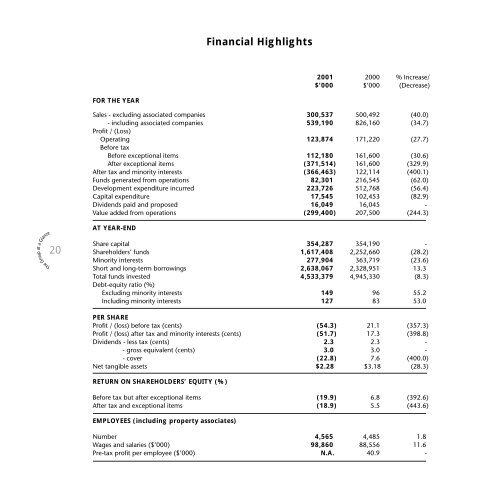
Financial Highlights<br />
2001 2000 % Increase/<br />
$’000 $’000 (Decrease)<br />
The Group at a Glance<br />
20<br />
FOR THE YEAR<br />
Sales - excluding associated companies 300,537 500,492 (40.0)<br />
- including associated companies 539,190 826,160 (34.7)<br />
Profit / (Loss)<br />
Operating 123,874 171,220 (27.7)<br />
Before tax<br />
Before exceptional items 112,180 161,600 (30.6)<br />
After exceptional items (371,514) 161,600 (329.9)<br />
After tax and minority interests (366,463) 122,114 (400.1)<br />
Funds generated from operations 82,301 216,545 (62.0)<br />
Development expenditure incurred 223,726 512,768 (56.4)<br />
Capital expenditure 17,545 102,453 (82.9)<br />
Dividends paid and proposed 16,049 16,045 -<br />
Value added from operations (299,400) 207,500 (244.3)<br />
AT YEAR-END<br />
Share capital 354,287 354,190 -<br />
Shareholders’ funds 1,617,408 2,252,660 (28.2)<br />
Minority interests 277,904 363,719 (23.6)<br />
Short and long-term borrowings 2,638,067 2,328,951 13.3<br />
Total funds invested 4,533,379 4,945,330 (8.3)<br />
Debt-equity ratio (%)<br />
Excluding minority interests 149 96 55.2<br />
Including minority interests 127 83 53.0<br />
PER SHARE<br />
Profit / (loss) before tax (cents) (54.3) 21.1 (357.3)<br />
Profit / (loss) after tax and minority interests (cents) (51.7) 17.3 (398.8)<br />
Dividends - less tax (cents) 2.3 2.3 -<br />
- gross equivalent (cents) 3.0 3.0 -<br />
- cover (22.8) 7.6 (400.0)<br />
Net tangible assets $2.28 $3.18 (28.3)<br />
RETURN ON SHAREHOLDERS’ EQUITY (%)<br />
Before tax but after exceptional items (19.9) 6.8 (392.6)<br />
After tax and exceptional items (18.9) 5.5 (443.6)<br />
EMPLOYEES (including property associates)<br />
Number 4,565 4,485 1.8<br />
Wages and salaries ($’000) 98,860 88,556 11.6<br />
Pre-tax profit per employee ($’000) N.A. 40.9 -