H-SAF Product Validation Report (PVR) PR-OBS-3
H-SAF Product Validation Report (PVR) PR-OBS-3
H-SAF Product Validation Report (PVR) PR-OBS-3

Create successful ePaper yourself
Turn your PDF publications into a flip-book with our unique Google optimized e-Paper software.
<strong>Product</strong>s <strong>Validation</strong> <strong>Report</strong>, 30 May 2010 - <strong>PVR</strong>-03 (<strong>Product</strong> <strong>PR</strong>-<strong>OBS</strong>-3) Page 34<br />
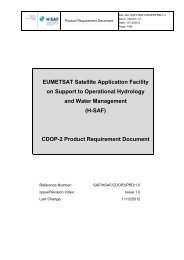
Mask of selected area.<br />
Radar measurement sector with<br />
selected area border.<br />
Radar measurement in the<br />
selected area only.<br />
Fig. 23 - Example of pick up pixels from radar measurement for selected area.<br />
Model input data are discharge and average data of precipitation<br />
and temperature. We calculate average value from ground stations<br />
and from radar measures. Meteorological forecasted data are taken<br />
from weather prediction model ALADIN.<br />
Average catchment precipitation value from ground station is<br />
calculated using Thiessen polygons method and arithmetic mean<br />
with different station weights assigned a priori. Average<br />
temperature value is calculated as weighted arithmetic mean.<br />
Catchment average precipitation value of 1-hour precipitation<br />
forecast from radar product is calculated as average value of pixels<br />
from the selected area (mask of subcatchment) (see Fig. 24).<br />
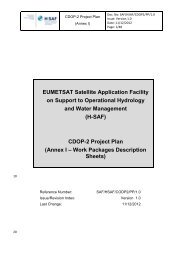
Model ALADIN supplies precipitation and temperature forecasts to<br />
hydrological model HRON. Since the resolution of forecast is too<br />
Fig. 24 - Example of separated ALADIN<br />
low for selected areas, the large pixel is separated into smaller forecast pixel to smaller pixels.<br />
pixels for better average value results (see Fig. 24). SHMÚ is<br />
planning to use satellite precipitation products in forecasting hydrological models in similar way.