The State of World Fisheries and Aquaculture 2010 - FAO
The State of World Fisheries and Aquaculture 2010 - FAO
The State of World Fisheries and Aquaculture 2010 - FAO

You also want an ePaper? Increase the reach of your titles
YUMPU automatically turns print PDFs into web optimized ePapers that Google loves.
3<br />
WORLD REVIEW OF FISHERIES AND<br />
AQUACULTURE<br />
<strong>Fisheries</strong> resources: trends in production, utilization <strong>and</strong> trade<br />
OVERVIEW<br />
Capture fisheries <strong>and</strong> aquaculture supplied the world with about 142 million tonnes<br />
<strong>of</strong> fish in 2008 (Table 1 <strong>and</strong> Figure 1; all data presented are subject to rounding). Of<br />
this, 115 million tonnes was used as human food, providing an estimated apparent per<br />
capita supply <strong>of</strong> about 17 kg (live weight equivalent), which is an all-time high (Table 1<br />
<strong>and</strong> Figure 2). <strong>Aquaculture</strong> accounted for 46 percent <strong>of</strong> total food fish supply, a slightly<br />
lower proportion than reported in <strong>The</strong> <strong>State</strong> <strong>of</strong> <strong>World</strong> <strong>Fisheries</strong> <strong>and</strong> <strong>Aquaculture</strong> 2008<br />
owing to a major downward revision <strong>of</strong> aquaculture <strong>and</strong> capture fishery production<br />
statistics by China (see below), but representing a continuing increase from 43 percent<br />
in 2006. Outside China, per capita supply has remained fairly static in recent years<br />
as growth in supply from aquaculture has <strong>of</strong>fset a small decline in capture fishery<br />
production <strong>and</strong> a rising population (Table 2). In 2008, per capita food fish supply<br />
was estimated at 13.7 kg if data for China are excluded. In 2007, fish accounted for<br />
15.7 percent <strong>of</strong> the global population’s intake <strong>of</strong> animal protein <strong>and</strong> 6.1 percent <strong>of</strong><br />
all protein consumed. Globally, fish provides more than 1.5 billion people with almost<br />
20 percent <strong>of</strong> their average per capita intake <strong>of</strong> animal protein, <strong>and</strong> 3.0 billion people<br />
with at least 15 percent <strong>of</strong> such protein. In 2007, the average annual per capita<br />
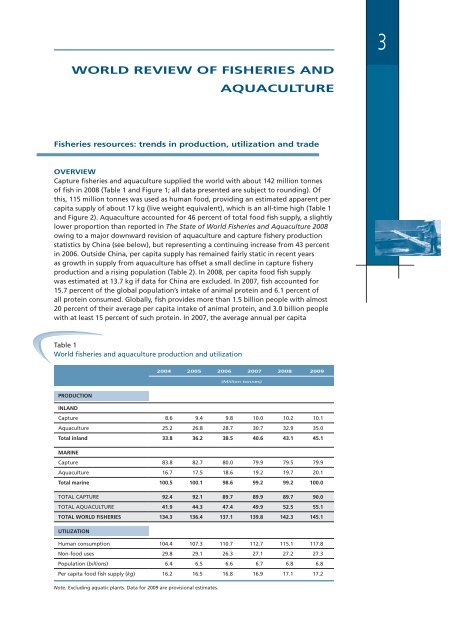
Table 1<br />
<strong>World</strong> fisheries <strong>and</strong> aquaculture production <strong>and</strong> utilization<br />
2004 2005 2006 2007 2008 2009<br />
(Million tonnes)<br />
PRODUCTION<br />
INLAND<br />
Capture 8.6 9.4 9.8 10.0 10.2 10.1<br />
<strong>Aquaculture</strong> 25.2 26.8 28.7 30.7 32.9 35.0<br />
Total inl<strong>and</strong> 33.8 36.2 38.5 40.6 43.1 45.1<br />
MARINE<br />
Capture 83.8 82.7 80.0 79.9 79.5 79.9<br />
<strong>Aquaculture</strong> 16.7 17.5 18.6 19.2 19.7 20.1<br />
Total marine 100.5 100.1 98.6 99.2 99.2 100.0<br />
TOTAL CAPTURE 92.4 92.1 89.7 89.9 89.7 90.0<br />
TOTAL AQUACULTURE 41.9 44.3 47.4 49.9 52.5 55.1<br />
TOTAL WORLD FISHERIES 134.3 136.4 137.1 139.8 142.3 145.1<br />
UTILIZATION<br />
Human consumption 104.4 107.3 110.7 112.7 115.1 117.8<br />
Non-food uses 29.8 29.1 26.3 27.1 27.2 27.3<br />
Population (billions) 6.4 6.5 6.6 6.7 6.8 6.8<br />
Per capita food fish supply (kg) 16.2 16.5 16.8 16.9 17.1 17.2<br />
Note: Excluding aquatic plants. Data for 2009 are provisional estimates.