The State of World Fisheries and Aquaculture 2010 - FAO
The State of World Fisheries and Aquaculture 2010 - FAO
The State of World Fisheries and Aquaculture 2010 - FAO

Create successful ePaper yourself
Turn your PDF publications into a flip-book with our unique Google optimized e-Paper software.
<strong>World</strong> review <strong>of</strong> fisheries <strong>and</strong> aquaculture<br />
23<br />
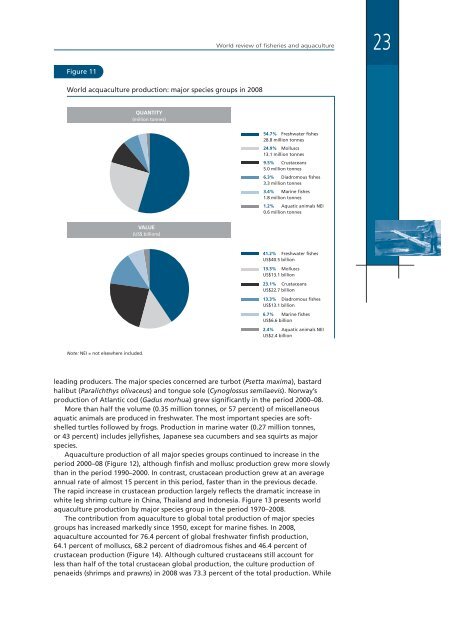
Figure 11<br />
<strong>World</strong> acquaculture production: major species groups in 2008<br />
QUANTITY<br />
(million tonnes)<br />
54.7% Freshwater fishes<br />
28.8 million tonnes<br />
24.9% Molluscs<br />
13.1 million tonnes<br />
9.5% Crustaceans<br />
5.0 million tonnes<br />
6.3% Diadromous fishes<br />
3.3 million tonnes<br />
3.4% Marine fishes<br />
1.8 million tonnes<br />
1.2% Aquatic animals NEI<br />
0.6 million tonnes<br />
VALUE<br />
(US$ billions)<br />
41.2% Freshwater fishes<br />
US$40.5 billion<br />
13.3% Molluscs<br />
US$13.1 billion<br />
23.1% Crustaceans<br />
US$22.7 billion<br />
13.3% Diadromous fishes<br />
US$13.1 billion<br />
6.7% Marine fishes<br />
US$6.6 billion<br />
2.4% Aquatic animals NEI<br />
US$2.4 billion<br />
Note: NEI = not elsewhere included.<br />
leading producers. <strong>The</strong> major species concerned are turbot (Psetta maxima), bastard<br />
halibut (Paralichthys olivaceus) <strong>and</strong> tongue sole (Cynoglossus semilaevis). Norway’s<br />
production <strong>of</strong> Atlantic cod (Gadus morhua) grew significantly in the period 2000–08.<br />
More than half the volume (0.35 million tonnes, or 57 percent) <strong>of</strong> miscellaneous<br />
aquatic animals are produced in freshwater. <strong>The</strong> most important species are s<strong>of</strong>tshelled<br />
turtles followed by frogs. Production in marine water (0.27 million tonnes,<br />
or 43 percent) includes jellyfishes, Japanese sea cucumbers <strong>and</strong> sea squirts as major<br />
species.<br />
<strong>Aquaculture</strong> production <strong>of</strong> all major species groups continued to increase in the<br />
period 2000–08 (Figure 12), although finfish <strong>and</strong> mollusc production grew more slowly<br />
than in the period 1990–2000. In contrast, crustacean production grew at an average<br />
annual rate <strong>of</strong> almost 15 percent in this period, faster than in the previous decade.<br />
<strong>The</strong> rapid increase in crustacean production largely reflects the dramatic increase in<br />
white leg shrimp culture in China, Thail<strong>and</strong> <strong>and</strong> Indonesia. Figure 13 presents world<br />
aquaculture production by major species group in the period 1970–2008.<br />
<strong>The</strong> contribution from aquaculture to global total production <strong>of</strong> major species<br />
groups has increased markedly since 1950, except for marine fishes. In 2008,<br />
aquaculture accounted for 76.4 percent <strong>of</strong> global freshwater finfish production,<br />
64.1 percent <strong>of</strong> molluscs, 68.2 percent <strong>of</strong> diadromous fishes <strong>and</strong> 46.4 percent <strong>of</strong><br />
crustacean production (Figure 14). Although cultured crustaceans still account for<br />
less than half <strong>of</strong> the total crustacean global production, the culture production <strong>of</strong><br />
penaeids (shrimps <strong>and</strong> prawns) in 2008 was 73.3 percent <strong>of</strong> the total production. While