The State of World Fisheries and Aquaculture 2010 - FAO
The State of World Fisheries and Aquaculture 2010 - FAO
The State of World Fisheries and Aquaculture 2010 - FAO

Create successful ePaper yourself
Turn your PDF publications into a flip-book with our unique Google optimized e-Paper software.
<strong>World</strong> review <strong>of</strong> fisheries <strong>and</strong> aquaculture<br />
15<br />
For the Southern Ocean (Antarctic) areas, <strong>FAO</strong> derives catch statistics from<br />
information produced by the Commission on the Conservation <strong>of</strong> Antarctic Marine<br />
Living Resources (CCAMLR). Owing to the strict <strong>and</strong> effective management regime<br />
applied by this RFB, catch variations in this region are usually small, but a marked<br />
increase in krill catches was registered in 2008.<br />
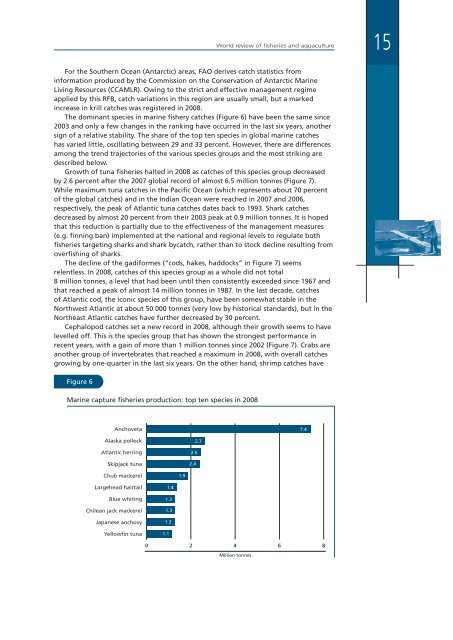
<strong>The</strong> dominant species in marine fishery catches (Figure 6) have been the same since<br />
2003 <strong>and</strong> only a few changes in the ranking have occurred in the last six years, another<br />
sign <strong>of</strong> a relative stability. <strong>The</strong> share <strong>of</strong> the top ten species in global marine catches<br />
has varied little, oscillating between 29 <strong>and</strong> 33 percent. However, there are differences<br />
among the trend trajectories <strong>of</strong> the various species groups <strong>and</strong> the most striking are<br />
described below.<br />
Growth <strong>of</strong> tuna fisheries halted in 2008 as catches <strong>of</strong> this species group decreased<br />
by 2.6 percent after the 2007 global record <strong>of</strong> almost 6.5 million tonnes (Figure 7).<br />
While maximum tuna catches in the Pacific Ocean (which represents about 70 percent<br />
<strong>of</strong> the global catches) <strong>and</strong> in the Indian Ocean were reached in 2007 <strong>and</strong> 2006,<br />
respectively, the peak <strong>of</strong> Atlantic tuna catches dates back to 1993. Shark catches<br />
decreased by almost 20 percent from their 2003 peak at 0.9 million tonnes. It is hoped<br />
that this reduction is partially due to the effectiveness <strong>of</strong> the management measures<br />
(e.g. finning ban) implemented at the national <strong>and</strong> regional levels to regulate both<br />
fisheries targeting sharks <strong>and</strong> shark bycatch, rather than to stock decline resulting from<br />
overfishing <strong>of</strong> sharks.<br />
<strong>The</strong> decline <strong>of</strong> the gadiformes (“cods, hakes, haddocks” in Figure 7) seems<br />
relentless. In 2008, catches <strong>of</strong> this species group as a whole did not total<br />
8 million tonnes, a level that had been until then consistently exceeded since 1967 <strong>and</strong><br />
that reached a peak <strong>of</strong> almost 14 million tonnes in 1987. In the last decade, catches<br />
<strong>of</strong> Atlantic cod, the iconic species <strong>of</strong> this group, have been somewhat stable in the<br />
Northwest Atlantic at about 50 000 tonnes (very low by historical st<strong>and</strong>ards), but in the<br />
Northeast Atlantic catches have further decreased by 30 percent.<br />
Cephalopod catches set a new record in 2008, although their growth seems to have<br />
levelled <strong>of</strong>f. This is the species group that has shown the strongest performance in<br />
recent years, with a gain <strong>of</strong> more than 1 million tonnes since 2002 (Figure 7). Crabs are<br />
another group <strong>of</strong> invertebrates that reached a maximum in 2008, with overall catches<br />
growing by one-quarter in the last six years. On the other h<strong>and</strong>, shrimp catches have<br />
Figure 6<br />
Marine capture fisheries production: top ten species in 2008<br />
Anchoveta<br />
7.4<br />
Alaska pollock<br />
Atlantic herring<br />
Skipjack tuna<br />
2.5<br />
2.4<br />
2.7<br />
Chub mackerel<br />
1.9<br />
Largehead hairtail<br />
Blue whiting<br />
Chilean jack mackerel<br />
Japanese anchovy<br />
Yellowfin tuna<br />
1.4<br />
1.3<br />
1.3<br />
1.3<br />
1.1<br />
0 2 4 6 8<br />
Million tonnes