The State of World Fisheries and Aquaculture 2010 - FAO
The State of World Fisheries and Aquaculture 2010 - FAO
The State of World Fisheries and Aquaculture 2010 - FAO

You also want an ePaper? Increase the reach of your titles
YUMPU automatically turns print PDFs into web optimized ePapers that Google loves.
<strong>World</strong> review <strong>of</strong> fisheries <strong>and</strong> aquaculture<br />
5<br />
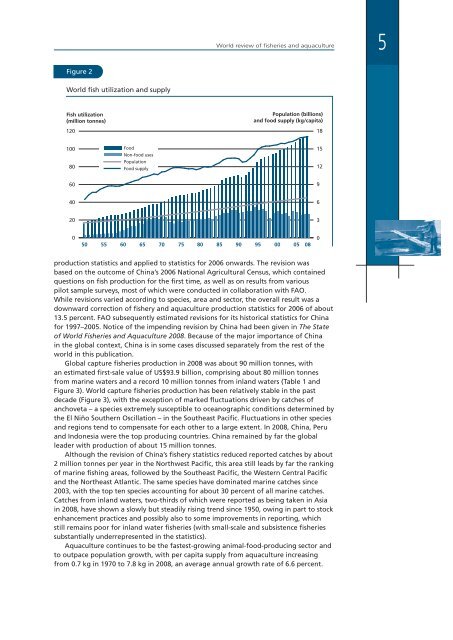
Figure 2<br />
<strong>World</strong> fish utilization <strong>and</strong> supply<br />
Fish utilization<br />
(million tonnes)<br />
120<br />
Population (billions)<br />
<strong>and</strong> food supply (kg/capita)<br />
18<br />
100<br />
80<br />
Food<br />
Non-food uses<br />
Population<br />
Food supply<br />
15<br />
12<br />
60<br />
9<br />
40<br />
6<br />
20<br />
3<br />
0<br />
50 55 60 65 70 75 80 85 90 95 00 05 08<br />
0<br />
production statistics <strong>and</strong> applied to statistics for 2006 onwards. <strong>The</strong> revision was<br />
based on the outcome <strong>of</strong> China’s 2006 National Agricultural Census, which contained<br />
questions on fish production for the first time, as well as on results from various<br />
pilot sample surveys, most <strong>of</strong> which were conducted in collaboration with <strong>FAO</strong>.<br />
While revisions varied according to species, area <strong>and</strong> sector, the overall result was a<br />
downward correction <strong>of</strong> fishery <strong>and</strong> aquaculture production statistics for 2006 <strong>of</strong> about<br />
13.5 percent. <strong>FAO</strong> subsequently estimated revisions for its historical statistics for China<br />
for 1997–2005. Notice <strong>of</strong> the impending revision by China had been given in <strong>The</strong> <strong>State</strong><br />
<strong>of</strong> <strong>World</strong> <strong>Fisheries</strong> <strong>and</strong> <strong>Aquaculture</strong> 2008. Because <strong>of</strong> the major importance <strong>of</strong> China<br />
in the global context, China is in some cases discussed separately from the rest <strong>of</strong> the<br />
world in this publication.<br />
Global capture fisheries production in 2008 was about 90 million tonnes, with<br />
an estimated first-sale value <strong>of</strong> US$93.9 billion, comprising about 80 million tonnes<br />
from marine waters <strong>and</strong> a record 10 million tonnes from inl<strong>and</strong> waters (Table 1 <strong>and</strong><br />
Figure 3). <strong>World</strong> capture fisheries production has been relatively stable in the past<br />
decade (Figure 3), with the exception <strong>of</strong> marked fluctuations driven by catches <strong>of</strong><br />
anchoveta – a species extremely susceptible to oceanographic conditions determined by<br />
the El Niño Southern Oscillation – in the Southeast Pacific. Fluctuations in other species<br />
<strong>and</strong> regions tend to compensate for each other to a large extent. In 2008, China, Peru<br />
<strong>and</strong> Indonesia were the top producing countries. China remained by far the global<br />
leader with production <strong>of</strong> about 15 million tonnes.<br />
Although the revision <strong>of</strong> China’s fishery statistics reduced reported catches by about<br />
2 million tonnes per year in the Northwest Pacific, this area still leads by far the ranking<br />
<strong>of</strong> marine fishing areas, followed by the Southeast Pacific, the Western Central Pacific<br />
<strong>and</strong> the Northeast Atlantic. <strong>The</strong> same species have dominated marine catches since<br />
2003, with the top ten species accounting for about 30 percent <strong>of</strong> all marine catches.<br />
Catches from inl<strong>and</strong> waters, two-thirds <strong>of</strong> which were reported as being taken in Asia<br />
in 2008, have shown a slowly but steadily rising trend since 1950, owing in part to stock<br />
enhancement practices <strong>and</strong> possibly also to some improvements in reporting, which<br />
still remains poor for inl<strong>and</strong> water fisheries (with small-scale <strong>and</strong> subsistence fisheries<br />
substantially underrepresented in the statistics).<br />
<strong>Aquaculture</strong> continues to be the fastest-growing animal-food-producing sector <strong>and</strong><br />
to outpace population growth, with per capita supply from aquaculture increasing<br />
from 0.7 kg in 1970 to 7.8 kg in 2008, an average annual growth rate <strong>of</strong> 6.6 percent.