The State of World Fisheries and Aquaculture 2010 - FAO
The State of World Fisheries and Aquaculture 2010 - FAO
The State of World Fisheries and Aquaculture 2010 - FAO

Create successful ePaper yourself
Turn your PDF publications into a flip-book with our unique Google optimized e-Paper software.
<strong>World</strong> review <strong>of</strong> fisheries <strong>and</strong> aquaculture<br />
27<br />
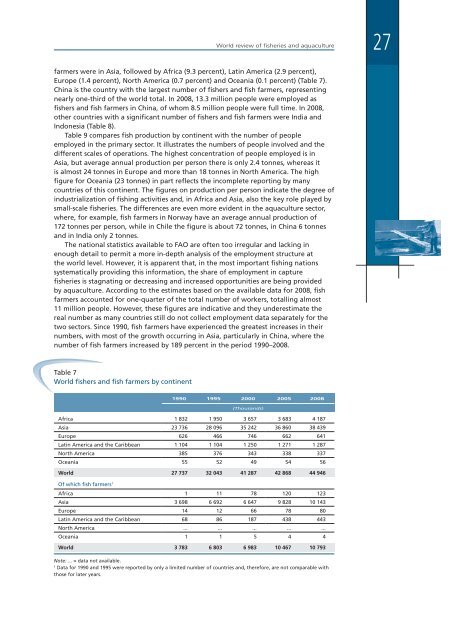
farmers were in Asia, followed by Africa (9.3 percent), Latin America (2.9 percent),<br />
Europe (1.4 percent), North America (0.7 percent) <strong>and</strong> Oceania (0.1 percent) (Table 7).<br />
China is the country with the largest number <strong>of</strong> fishers <strong>and</strong> fish farmers, representing<br />
nearly one-third <strong>of</strong> the world total. In 2008, 13.3 million people were employed as<br />
fishers <strong>and</strong> fish farmers in China, <strong>of</strong> whom 8.5 million people were full time. In 2008,<br />
other countries with a significant number <strong>of</strong> fishers <strong>and</strong> fish farmers were India <strong>and</strong><br />
Indonesia (Table 8).<br />
Table 9 compares fish production by continent with the number <strong>of</strong> people<br />
employed in the primary sector. It illustrates the numbers <strong>of</strong> people involved <strong>and</strong> the<br />
different scales <strong>of</strong> operations. <strong>The</strong> highest concentration <strong>of</strong> people employed is in<br />
Asia, but average annual production per person there is only 2.4 tonnes, whereas it<br />
is almost 24 tonnes in Europe <strong>and</strong> more than 18 tonnes in North America. <strong>The</strong> high<br />
figure for Oceania (23 tonnes) in part reflects the incomplete reporting by many<br />
countries <strong>of</strong> this continent. <strong>The</strong> figures on production per person indicate the degree <strong>of</strong><br />
industrialization <strong>of</strong> fishing activities <strong>and</strong>, in Africa <strong>and</strong> Asia, also the key role played by<br />
small-scale fisheries. <strong>The</strong> differences are even more evident in the aquaculture sector,<br />
where, for example, fish farmers in Norway have an average annual production <strong>of</strong><br />
172 tonnes per person, while in Chile the figure is about 72 tonnes, in China 6 tonnes<br />
<strong>and</strong> in India only 2 tonnes.<br />
<strong>The</strong> national statistics available to <strong>FAO</strong> are <strong>of</strong>ten too irregular <strong>and</strong> lacking in<br />
enough detail to permit a more in-depth analysis <strong>of</strong> the employment structure at<br />
the world level. However, it is apparent that, in the most important fishing nations<br />
systematically providing this information, the share <strong>of</strong> employment in capture<br />
fisheries is stagnating or decreasing <strong>and</strong> increased opportunities are being provided<br />
by aquaculture. According to the estimates based on the available data for 2008, fish<br />
farmers accounted for one-quarter <strong>of</strong> the total number <strong>of</strong> workers, totalling almost<br />
11 million people. However, these figures are indicative <strong>and</strong> they underestimate the<br />
real number as many countries still do not collect employment data separately for the<br />
two sectors. Since 1990, fish farmers have experienced the greatest increases in their<br />
numbers, with most <strong>of</strong> the growth occurring in Asia, particularly in China, where the<br />
number <strong>of</strong> fish farmers increased by 189 percent in the period 1990–2008.<br />
Table 7<br />
<strong>World</strong> fishers <strong>and</strong> fish farmers by continent<br />
1990 1995 2000 2005 2008<br />
(Thous<strong>and</strong>s)<br />
Africa 1 832 1 950 3 657 3 683 4 187<br />
Asia 23 736 28 096 35 242 36 860 38 439<br />
Europe 626 466 746 662 641<br />
Latin America <strong>and</strong> the Caribbean 1 104 1 104 1 250 1 271 1 287<br />
North America 385 376 343 338 337<br />
Oceania 55 52 49 54 56<br />
<strong>World</strong> 27 737 32 043 41 287 42 868 44 946<br />
Of which fish farmers 1<br />
Africa 1 11 78 120 123<br />
Asia 3 698 6 692 6 647 9 828 10 143<br />
Europe 14 12 66 78 80<br />
Latin America <strong>and</strong> the Caribbean 68 86 187 438 443<br />
North America ... ... ... ... ...<br />
Oceania 1 1 5 4 4<br />
<strong>World</strong> 3 783 6 803 6 983 10 467 10 793<br />
Note: ... = data not available.<br />
1<br />
Data for 1990 <strong>and</strong> 1995 were reported by only a limited number <strong>of</strong> countries <strong>and</strong>, therefore, are not comparable with<br />
those for later years.