The State of World Fisheries and Aquaculture 2010 - FAO
The State of World Fisheries and Aquaculture 2010 - FAO
The State of World Fisheries and Aquaculture 2010 - FAO

Create successful ePaper yourself
Turn your PDF publications into a flip-book with our unique Google optimized e-Paper software.
<strong>World</strong> review <strong>of</strong> fisheries <strong>and</strong> aquaculture<br />
21<br />
respectively. However, the combined share <strong>of</strong> the least-developed countries remains<br />
very low in terms <strong>of</strong> world aquaculture production quantity (3.6 percent) <strong>and</strong> value<br />
(3.1 percent). <strong>Aquaculture</strong> production <strong>of</strong> 1.9 million tonnes in 2008 for the leastdeveloped<br />
countries was dominated by Bangladesh (52.8 percent) <strong>and</strong> Myanmar<br />
(35.5 percent), followed by the Lao People’s Democratic Republic (4.1 percent), Ug<strong>and</strong>a<br />
(2.7 percent), Cambodia (2.1 percent) <strong>and</strong> Nepal (1.4 percent). Developed countries<br />
produced only 3.92 million tonnes, accounting for 7.5 percent <strong>of</strong> world aquaculture<br />
production in terms <strong>of</strong> quantity, but the value <strong>of</strong> their production was 14.6 percent <strong>of</strong><br />
the world total (Table 6).<br />
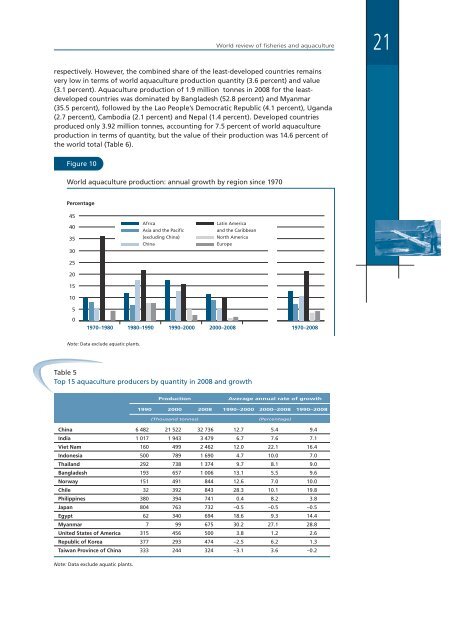
Figure 10<br />
<strong>World</strong> aquaculture production: annual growth by region since 1970<br />
Percentage<br />
45<br />
40<br />
35<br />
30<br />
25<br />
20<br />
15<br />
10<br />
5<br />
Africa<br />
Asia <strong>and</strong> the Pacific<br />
(excluding China)<br />
China<br />
Latin America<br />
<strong>and</strong> the Caribbean<br />
North America<br />
Europe<br />
0<br />
1970–1980 1980–1990 1990–2000 2000–2008 1970–2008<br />
Note: Data exclude aquatic plants.<br />
Table 5<br />
Top 15 aquaculture producers by quantity in 2008 <strong>and</strong> growth<br />
Production<br />
Average annual rate <strong>of</strong> growth<br />
1990 2000 2008 1990–2000 2000–2008 1990–2008<br />
(Thous<strong>and</strong> tonnes)<br />
(Percentage)<br />
China 6 482 21 522 32 736 12.7 5.4 9.4<br />
India 1 017 1 943 3 479 6.7 7.6 7.1<br />
Viet Nam 160 499 2 462 12.0 22.1 16.4<br />
Indonesia 500 789 1 690 4.7 10.0 7.0<br />
Thail<strong>and</strong> 292 738 1 374 9.7 8.1 9.0<br />
Bangladesh 193 657 1 006 13.1 5.5 9.6<br />
Norway 151 491 844 12.6 7.0 10.0<br />
Chile 32 392 843 28.3 10.1 19.8<br />
Philippines 380 394 741 0.4 8.2 3.8<br />
Japan 804 763 732 –0.5 –0.5 –0.5<br />
Egypt 62 340 694 18.6 9.3 14.4<br />
Myanmar 7 99 675 30.2 27.1 28.8<br />
United <strong>State</strong>s <strong>of</strong> America 315 456 500 3.8 1.2 2.6<br />
Republic <strong>of</strong> Korea 377 293 474 –2.5 6.2 1.3<br />
Taiwan Province <strong>of</strong> China 333 244 324 –3.1 3.6 –0.2<br />
Note: Data exclude aquatic plants.