Creating Graphs in Google Earth - Alaska Tsunami Education Program
Creating Graphs in Google Earth - Alaska Tsunami Education Program
Creating Graphs in Google Earth - Alaska Tsunami Education Program

You also want an ePaper? Increase the reach of your titles
YUMPU automatically turns print PDFs into web optimized ePapers that Google loves.
<strong>Creat<strong>in</strong>g</strong> <strong>Graphs</strong> <strong>in</strong> <strong>Google</strong> <strong>Earth</strong><br />
Grades<br />
9-12<br />
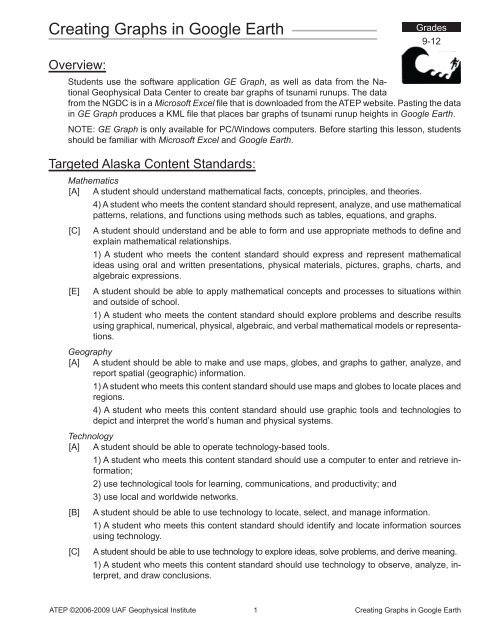
Overview:<br />
Students use the software application GE Graph, as well as data from the National<br />
Geophysical Data Center to create bar graphs of tsunami runups. The data<br />
from the NGDC is <strong>in</strong> a Microsoft Excel file that is downloaded from the ATEP website. Past<strong>in</strong>g the data<br />
<strong>in</strong> GE Graph produces a KML file that places bar graphs of tsunami runup heights <strong>in</strong> <strong>Google</strong> <strong>Earth</strong>.<br />
NOTE: GE Graph is only available for PC/W<strong>in</strong>dows computers. Before start<strong>in</strong>g this lesson, students<br />
should be familiar with Microsoft Excel and <strong>Google</strong> <strong>Earth</strong>.<br />
Targeted <strong>Alaska</strong> Content Standards:<br />
Mathematics<br />
[A] A student should understand mathematical facts, concepts, pr<strong>in</strong>ciples, and theories.<br />
4) A student who meets the content standard should represent, analyze, and use mathematical<br />
patterns, relations, and functions us<strong>in</strong>g methods such as tables, equations, and graphs.<br />
[C]<br />
[E]<br />
A student should understand and be able to form and use appropriate methods to def<strong>in</strong>e and<br />
expla<strong>in</strong> mathematical relationships.<br />
1) A student who meets the content standard should express and represent mathematical<br />
ideas us<strong>in</strong>g oral and written presentations, physical materials, pictures, graphs, charts, and<br />
algebraic expressions.<br />
A student should be able to apply mathematical concepts and processes to situations with<strong>in</strong><br />
and outside of school.<br />
1) A student who meets the content standard should explore problems and describe results<br />
us<strong>in</strong>g graphical, numerical, physical, algebraic, and verbal mathematical models or representations.<br />
Geography<br />
[A] A student should be able to make and use maps, globes, and graphs to gather, analyze, and<br />
report spatial (geographic) <strong>in</strong>formation.<br />
1) A student who meets this content standard should use maps and globes to locate places and<br />
regions.<br />
4) A student who meets this content standard should use graphic tools and technologies to<br />
depict and <strong>in</strong>terpret the world’s human and physical systems.<br />
Technology<br />
[A] A student should be able to operate technology-based tools.<br />
1) A student who meets this content standard should use a computer to enter and retrieve <strong>in</strong>formation;<br />
2) use technological tools for learn<strong>in</strong>g, communications, and productivity; and<br />
3) use local and worldwide networks.<br />
[B]<br />
[C]<br />
A student should be able to use technology to locate, select, and manage <strong>in</strong>formation.<br />
1) A student who meets this content standard should identify and locate <strong>in</strong>formation sources<br />
us<strong>in</strong>g technology.<br />
A student should be able to use technology to explore ideas, solve problems, and derive mean<strong>in</strong>g.<br />
1) A student who meets this content standard should use technology to observe, analyze, <strong>in</strong>terpret,<br />
and draw conclusions.<br />
ATEP ©2006-2009 UAF Geophysical Institute 1 <strong>Creat<strong>in</strong>g</strong> <strong>Graphs</strong> <strong>in</strong> <strong>Google</strong> <strong>Earth</strong>
Objectives:<br />
The student will:<br />
• download, select, copy, and paste data from a Microsoft Excel file;<br />
• use GE Graph to create bar graphs of tsunamis for placement <strong>in</strong> <strong>Google</strong> <strong>Earth</strong>; and<br />
• analyze spatial data <strong>in</strong> <strong>Google</strong> <strong>Earth</strong>.<br />
Materials:<br />
• Computer with Microsoft Excel, <strong>Google</strong> <strong>Earth</strong>, and GE Graph <strong>in</strong>stalled<br />
• Microsoft Excel spreadsheet “<strong>Tsunami</strong> Excel for GE Graph.xls”<br />
• STUDENT WORKSHEET: “<strong>Creat<strong>in</strong>g</strong> <strong>Graphs</strong> <strong>in</strong> <strong>Google</strong> <strong>Earth</strong>”<br />
Whole Picture:<br />
The National Geophysical Data Center has a large collection of post-event natural hazard data available<br />
at http://www.ngdc.noaa.gov/hazard/tsu_db.shtml. Over 400 tsunami runups for <strong>Alaska</strong> have<br />
been copied from NGDC and placed <strong>in</strong> a Microsoft Excel file. In order to visualize the location where<br />
the tsunamis occurred, and the relative magnitude, the software application GE Graph will be used.<br />
GE Graph will create a KML file of the data that can be viewed <strong>in</strong> <strong>Google</strong> <strong>Earth</strong>.<br />
NOTE: KML is an acronym for Keyhole Markup Language. It is the language used with <strong>Google</strong><br />
<strong>Earth</strong>.<br />
Activity Preparation:<br />
1. If not already <strong>in</strong>stalled, download and <strong>in</strong>stall the program <strong>Google</strong> <strong>Earth</strong> at http://earth.google.com for<br />
each computer. Click on the Download button, the Agree and Download button to start the download.<br />
Double click on the downloaded file to <strong>in</strong>stall it.<br />
2. If not already <strong>in</strong>stalled, download and the program GE Graph at http://www.sgrillo.net/googleearth/<br />
gegraph.htm for each computer. Click on the Download–Full Install to start to the download. Double<br />
click on the downloaded file to <strong>in</strong>stall it.<br />
Activity Procedure:<br />
1. Ask students what part(s) of <strong>Alaska</strong> has been hit the most by tsunamis (Aleutians, Southeast, Kodiak,<br />
etc.). Ask students if any communities along the Beaufort Sea or Ber<strong>in</strong>g Sea have ever been hit by a<br />
tsunami. Next, ask if there are any communities along the Gulf of <strong>Alaska</strong> that have not been hit.<br />
2. Have students download the Microsoft Excel file “<strong>Tsunami</strong> Excel for GE Graph” from the Grades 9<br />
–12 section of the ATEP website at http://www.aktsunami.com/lessons/GITExercises.html. After<br />
download<strong>in</strong>g the file, students should open the file <strong>in</strong> Microsoft Excel and scroll through the Latitude<br />
and Longitude column. Ask students aga<strong>in</strong> if the coord<strong>in</strong>ate <strong>in</strong>formation helps <strong>in</strong> answer<strong>in</strong>g how many<br />
tsunamis occurred <strong>in</strong> the Beaufort, Ber<strong>in</strong>g Sea or Gulf of <strong>Alaska</strong>.<br />
3. Guide students through us<strong>in</strong>g GE Graph to map <strong>in</strong> <strong>Google</strong> <strong>Earth</strong> the locations where tsunamis have<br />
struck <strong>Alaska</strong>.<br />
ATEP ©2006-2009 UAF Geophysical Institute 2 <strong>Creat<strong>in</strong>g</strong> <strong>Graphs</strong> <strong>in</strong> <strong>Google</strong> <strong>Earth</strong>
Answers:<br />
1. Answers will vary<br />
2. No<br />
3. 12.19 meters<br />
4. Lituya Bay, 524.26 meters.<br />
5. Yes<br />
6. Along the Aleutians and Southcentral coast.<br />
7. Attu, Massacre Bay.<br />
8. Around Kodiak and the Gulf of <strong>Alaska</strong><br />
9. Shoup Bay, 67.1 meters.<br />
10. Yes<br />
11. No<br />
12. Aleutians<br />
13. Unimak Island, 35.05 meters<br />
14. Umnak Island (Pacific Coast), 22.8 meters<br />
15. It could be used to graph the magnitude of the earthquake at the epicenter of the quake.<br />
16. Answers could vary. It could be used to graph populations of countries, energy use, reported cases<br />
of disease, etc.<br />
17. Answers will vary.<br />
18. Crescent City, California. 4.79 meters<br />
19. Waimea Bay, Hawaii. 4.9 meters.<br />
20. No<br />
21. 0.4 meters<br />
ATEP ©2006-2009 UAF Geophysical Institute 3 <strong>Creat<strong>in</strong>g</strong> <strong>Graphs</strong> <strong>in</strong> <strong>Google</strong> <strong>Earth</strong>
<strong>Creat<strong>in</strong>g</strong> <strong>Graphs</strong> <strong>in</strong> <strong>Google</strong> <strong>Earth</strong><br />
Student Worksheet (page 1 of 7)<br />
Grades<br />
9-12<br />
<strong>Alaska</strong> experiences a large number of earthquakes each year. Some past earthquakes<br />
generated devastat<strong>in</strong>g tsunamis. The National Geophysical Data Center<br />
(NGDC) has a large collection of post-event tsunami data available on its website. Us<strong>in</strong>g data from<br />
NGDC, and the program GE Graph, a bar graph of past tsunamis will be created that can be viewed <strong>in</strong><br />
<strong>Google</strong> <strong>Earth</strong>.<br />
Part 1: View<strong>in</strong>g All <strong>Tsunami</strong>s <strong>in</strong> <strong>Alaska</strong><br />
STEP 1:<br />
STEP 2:<br />
STEP 3:<br />
Download the “<strong>Tsunami</strong> Excel for GE Graph” file from the <strong>Alaska</strong> <strong>Tsunami</strong> <strong>Education</strong> <strong>Program</strong><br />
website at http://www.aktsunami.org. on the ATEP website. From the ATEP home<br />
page click on Lessons uGIT Exercises u<strong>Tsunami</strong> Excel for GE Graph (grouped with the<br />
Grades 9-12 lessons).<br />
Launch Microsoft Excel and open the “<strong>Tsunami</strong> Excel for GE Graph” file.<br />
The file opens with all the <strong>in</strong>formation from the NGDC website, <strong>in</strong>clud<strong>in</strong>g the date, time, locations,<br />
etc. of tsunamis that have struck <strong>Alaska</strong> from 1737 to 2008. Look at the data on the<br />
first worksheet then click on the >.5 meter tab at the bottom of the Microsoft Excel w<strong>in</strong>dow.<br />
This worksheet <strong>in</strong>cludes only runups greater than .5 meters along with the location name,<br />
latitude, longitude, runup, and year of the tsunami.<br />
STEP 4:<br />
STEP 5:<br />
Click <strong>in</strong> cell A2 (AMCHITKA, AK) to select it. Scroll to the bottom of the data. Hold down the<br />
shift key and click <strong>in</strong> cell D148 (.51) to select all the cells between A2 through D148. The<br />
data <strong>in</strong> column E (Year) is not needed. Press Ctrl-C, or Edit uCopy from the menu, to copy<br />
the data.<br />
If you haven’t done so already, <strong>in</strong>stall the GE Graph application, then launch it. At the bottom<br />
right of the GE Graph screen click on Paste grid from clipboard.<br />
Paste grid from clipboard<br />
ATEP ©2006-2009 UAF Geophysical Institute 4 <strong>Creat<strong>in</strong>g</strong> <strong>Graphs</strong> <strong>in</strong> <strong>Google</strong> <strong>Earth</strong>
<strong>Creat<strong>in</strong>g</strong> <strong>Graphs</strong> <strong>in</strong> <strong>Google</strong> <strong>Earth</strong><br />
Student Worksheet (page 2 of 7)<br />
STEP 6:<br />
Make the follow<strong>in</strong>g changes to the GE Graph sett<strong>in</strong>gs:<br />
1. Use the drop down arrow to change the Polygon sides to 6.<br />
2. Change size to Constant.<br />
3. Click on Show Scale <strong>in</strong> GE.<br />
4. In the First l<strong>in</strong>e of the Title, type: <strong>Tsunami</strong> Runups Greater Than .5 Meters. On the Second<br />
l<strong>in</strong>e of the Title, type: 1737 to 1996.<br />
5. Click on Show Title <strong>in</strong> GE.<br />
6. Change Size to 5, and use the drop down arrow to select Kilometers.<br />
7. Deselect Automatic scale and enter 3000 for Height factor.<br />
8. Deselect the Outl<strong>in</strong>e.<br />
9. Change Labels by click<strong>in</strong>g Place name and value.<br />
1<br />
4<br />
2<br />
5<br />
6<br />
3<br />
8<br />
7<br />
9<br />
STEP 7:<br />
Click Run on the GE Graph menu bar. From the “Save File” dialog box type the file name: all<br />
runups, leave it as a .kml file and click Save. The file should open <strong>in</strong> <strong>Google</strong> <strong>Earth</strong>.<br />
ATEP ©2006-2009 UAF Geophysical Institute 5 <strong>Creat<strong>in</strong>g</strong> <strong>Graphs</strong> <strong>in</strong> <strong>Google</strong> <strong>Earth</strong>
Name:____________________________________<br />
<strong>Creat<strong>in</strong>g</strong> <strong>Graphs</strong> <strong>in</strong> <strong>Google</strong> <strong>Earth</strong><br />
Student Worksheet (page 3 of 7)<br />
STEP 8:<br />
Use the navigation tools <strong>in</strong> <strong>Google</strong> <strong>Earth</strong> to fly to <strong>Alaska</strong>. The data should be visible as a<br />
6-sided bars extend<strong>in</strong>g upwards from each location, as shown below.<br />
STEP 9:<br />
Answer the follow<strong>in</strong>g questions:<br />
1. In <strong>Google</strong> <strong>Earth</strong> navigate to your community. What is the height of the tsunami that struck nearest<br />
your community? ________________________________________________________________<br />
2. Have there been any tsunamis along the north coast of <strong>Alaska</strong>? ___________________________<br />
3. What was the height of the only tsunami recorded <strong>in</strong> Norton Sound?________________________<br />
4. Name of the location and the height of the highest tsunami recorded <strong>in</strong> <strong>Alaska</strong>.<br />
Location: _____________________________________<br />
Height: ________________________<br />
5. Have there been tsunamis <strong>in</strong> Southeast <strong>Alaska</strong>? _______________________________________<br />
6. Where do most tsunamis occur <strong>in</strong> <strong>Alaska</strong>? ____________________________________________<br />
7. What is the location of the western-most tsunami that has been recorded? ___________________<br />
STEP10:<br />
When f<strong>in</strong>ished with Part 1 click off the all runups graph under <strong>Google</strong><br />
<strong>Earth</strong>’s Temporary Places by uncheck<strong>in</strong>g the box next to the file.<br />
ATEP ©2006-2009 UAF Geophysical Institute 6 <strong>Creat<strong>in</strong>g</strong> <strong>Graphs</strong> <strong>in</strong> <strong>Google</strong> <strong>Earth</strong>
<strong>Creat<strong>in</strong>g</strong> <strong>Graphs</strong> <strong>in</strong> <strong>Google</strong> <strong>Earth</strong><br />
Student Worksheet (page 4 of 7)<br />
Part 2: View<strong>in</strong>g the 1946, 1957 and 1964 <strong>Tsunami</strong>s<br />
<strong>Earth</strong>quakes <strong>in</strong> 1946, 1957 and 1964 generated large and widespread tsunamis <strong>in</strong> <strong>Alaska</strong>. GE Graph will<br />
show the <strong>Alaska</strong> locations hit by each tsunamis and the relative height of the runup for each tsunami.<br />
STEP 11: In Microsoft Excel scroll down to the first data for the year 1946, which occurs <strong>in</strong> row A37.<br />
Click on cell A37, then scroll to row 44, hold down the shift key, and click <strong>in</strong> cell D44 to<br />
select cells A37 to D44. Do not select any data from the “Year” column (column E). Press<br />
Ctrl-C, or Edit uCopy from the menu, to copy the data. When you do this, be sure not to<br />
also copy the year, 1946.<br />
STEP 12:<br />
In GE Graph click on Paste grid from clipboard then make the follow<strong>in</strong>g changes to the<br />
GE Graph sett<strong>in</strong>gs:<br />
1. Polygon sides: 6<br />
2. Color: Constant<br />
3. Size: 5 Kilometers<br />
4. Height factor: 3000<br />
5. Color: Click the Fill check box, then click the Fill Color selection box. Change the color<br />
to Blue, then click OK. Click Outl<strong>in</strong>e and choose Blue as the l<strong>in</strong>e color, or leave it unchecked.<br />
6. Labels: Click on Place name and value.<br />
1<br />
2<br />
3<br />
4<br />
5<br />
6<br />
ATEP ©2006-2009 UAF Geophysical Institute 7 <strong>Creat<strong>in</strong>g</strong> <strong>Graphs</strong> <strong>in</strong> <strong>Google</strong> <strong>Earth</strong>
<strong>Creat<strong>in</strong>g</strong> <strong>Graphs</strong> <strong>in</strong> <strong>Google</strong> <strong>Earth</strong><br />
Student Worksheet (page 5 of 7)<br />
STEP 13:<br />
From the GE Graph menu click Run. Name the file “1946.” Leave the type .kml and click<br />
Save. The file should open <strong>in</strong> <strong>Google</strong> <strong>Earth</strong>.<br />
STEP 14:<br />
STEP 15:<br />
Follow STEPS 11-13 to make a graph for the 1957 tsunami. In Microsoft Excel, select the values<br />
A49 to D57 for the 1957 tsunami. Copy the data and Paste grid from clipboard <strong>in</strong> GE Graph.<br />
Use the same options that were used for the 1946 graph, but for<br />
the 1957 tsunami, select Red for the graph color <strong>in</strong> GE Graph.<br />
STEP 16: Click Run. Save the file as “1957”.<br />
STEP 17:<br />
STEP 18:<br />
Follow the same procedure as above to select the data for the 1964 tsunami from Microsoft<br />
Excel and paste the data <strong>in</strong>to GE Graph.<br />
Use the same options used for the 1946 and 1957 graphs, but change the graph color to<br />
green for the 1964 tsunami.<br />
STEP 19: In the Title, type: <strong>Tsunami</strong> Runups <strong>in</strong> the first l<strong>in</strong>e. Type: 1946=Blue 1957=Red 1964 =<br />
Green. In the second l<strong>in</strong>e, click Show title <strong>in</strong> GE.<br />
STEP 20:<br />
In GE Graph click Run on the menu. Save the file as “1964”. The graph with 1964 tsunami<br />
data should open <strong>in</strong> <strong>Google</strong> <strong>Earth</strong>. When f<strong>in</strong>ished, the <strong>Google</strong> <strong>Earth</strong> screen should look like<br />
the one shown here.<br />
ATEP ©2006-2009 UAF Geophysical Institute 8 <strong>Creat<strong>in</strong>g</strong> <strong>Graphs</strong> <strong>in</strong> <strong>Google</strong> <strong>Earth</strong>
Name:____________________________________<br />
<strong>Creat<strong>in</strong>g</strong> <strong>Graphs</strong> <strong>in</strong> <strong>Google</strong> <strong>Earth</strong><br />
Student Worksheet (page 6 of 7)<br />
STEP 21:<br />
Answer the follow<strong>in</strong>g questions:<br />
8. In what part of <strong>Alaska</strong> were the highest runups recorded dur<strong>in</strong>g the 1964 tsunami?<br />
______________________________________________________________________________<br />
9. Dur<strong>in</strong>g the 1964 tsunami, <strong>in</strong> what location was the highest runup recorded? What was the height?<br />
Location: ____________________________________<br />
Height: _________________________<br />
10. Did the 1964 tsunami reach Southeast <strong>Alaska</strong>? ________________________________________<br />
11. Were any runups greater than .5 meters recorded <strong>in</strong> the western Aleutians from the 1964 tsunami?<br />
______________________________________________________________________________<br />
12. What part of <strong>Alaska</strong> was hit by the 1946 and 1957 tsunamis? _____________________________<br />
13. What is the location and height of the highest runup <strong>in</strong> the 1946 tsunami?<br />
Location: ____________________________________<br />
Height: _________________________<br />
14. What is the location and height of the highest runup <strong>in</strong> the 1957 tsunami?<br />
Location: ____________________________________<br />
Height: _________________________<br />
15. In this lesson, GE Graph is used to compare tsunamis. How could this software be used to display<br />
earthquakes? ___________________________________________________________________<br />
______________________________________________________________________________<br />
______________________________________________________________________________<br />
16. Give two examples of types of data that could be graphed <strong>in</strong> <strong>Google</strong> <strong>Earth</strong> us<strong>in</strong>g GE Graph.<br />
_____________________________________<br />
______________________________________<br />
ATEP ©2006-2009 UAF Geophysical Institute 9 <strong>Creat<strong>in</strong>g</strong> <strong>Graphs</strong> <strong>in</strong> <strong>Google</strong> <strong>Earth</strong>
Name:____________________________________<br />
<strong>Creat<strong>in</strong>g</strong> <strong>Graphs</strong> <strong>in</strong> <strong>Google</strong> <strong>Earth</strong><br />
Student Worksheet (page 7 of 7)<br />
Part 3: View<strong>in</strong>g Worldwide Data from the 1964 <strong>Tsunami</strong><br />
STEP 21.<br />
The Microsoft Excel spreadsheet also <strong>in</strong>cludes the world wide tsunami runup data for the<br />
1964 tsunami. Consider what options to use <strong>in</strong> GE Graph for the best way to display the<br />
data.<br />
STEP 22.<br />
Exam<strong>in</strong>e the data around the Pacific rim, <strong>in</strong>clud<strong>in</strong>g the west coast the U.S., Hawaii and Japan,<br />
to see the runups of the tsunami.<br />
Answer the follow<strong>in</strong>g questions:<br />
17. List the options selected <strong>in</strong> GE Graph to display the data.<br />
18. Where did the highest runup along west coast of the U.S. occur, and what was the height of runup?<br />
Location: ____________________________________<br />
Height: _________________________<br />
19. In what location did the highest runup <strong>in</strong> Hawaii occur, and what was the height of the runup?<br />
Location: ____________________________________<br />
Height: _________________________<br />
20. Did any runups of a height greater than 1-meter occur <strong>in</strong> Japan? __________________________<br />
21. The 1964 tsunami reached Antarctica. What was the height of the runup on the Palmer Pen<strong>in</strong>sula?<br />
________________________________<br />
ATEP ©2006-2009 UAF Geophysical Institute 10 <strong>Creat<strong>in</strong>g</strong> <strong>Graphs</strong> <strong>in</strong> <strong>Google</strong> <strong>Earth</strong>