1998 Annual Report - Four Seasons Hotels and Resorts
1998 Annual Report - Four Seasons Hotels and Resorts
1998 Annual Report - Four Seasons Hotels and Resorts

You also want an ePaper? Increase the reach of your titles
YUMPU automatically turns print PDFs into web optimized ePapers that Google loves.
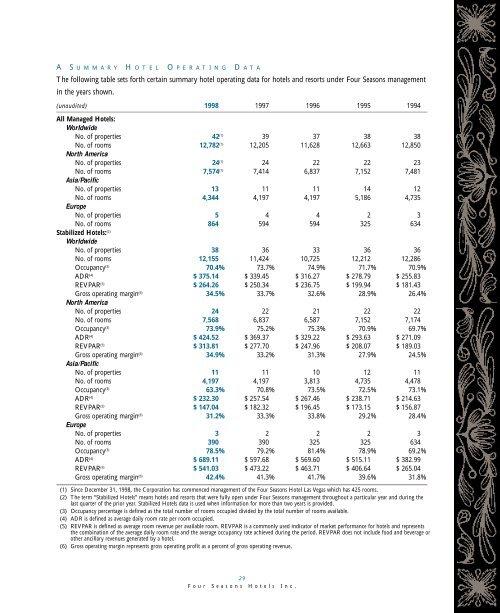
A S U M M A R Y H O T E L O P E R A T I N G D ATAThe following table sets forth certain summary hotel operating data for hotels <strong>and</strong> resorts under <strong>Four</strong> <strong>Seasons</strong> managementin the years shown.(unaudited) <strong>1998</strong> 1997 1996 1995 1994All Managed <strong>Hotels</strong>:WorldwideNo. of properties 42 (1) 39 37 38 38No. of rooms 12,782 (1) 12,205 11,628 12,663 12,850North AmericaNo. of properties 24 (1) 24 22 22 23No. of rooms 7,574 (1) 7,414 6,837 7,152 7,481Asia/PacificNo. of properties 13 11 11 14 12No. of rooms 4,344 4,197 4,197 5,186 4,735EuropeNo. of properties 5 4 4 2 3No. of rooms 864 594 594 325 634Stabilized <strong>Hotels</strong>: (2)WorldwideNo. of properties 38 36 33 36 36No. of rooms 12,155 11,424 10,725 12,212 12,286Occupancy (3) 70.4% 73.7% 74.9% 71.7% 70.9%ADR (4) $ 375.14 $ 339.45 $ 316.27 $ 278.79 $ 255.83REVPAR (5) $ 264.26 $ 250.34 $ 236.75 $ 199.94 $ 181.43Gross operating margin (6) 34.5% 33.7% 32.6% 28.9% 26.4%North AmericaNo. of properties 24 22 21 22 22No. of rooms 7,568 6,837 6,587 7,152 7,174Occupancy (3) 73.9% 75.2% 75.3% 70.9% 69.7%ADR (4) $ 424.52 $ 369.37 $ 329.22 $ 293.63 $ 271.09REVPAR (5) $ 313.81 $ 277.70 $ 247.96 $ 208.07 $ 189.03Gross operating margin (6) 34.9% 33.2% 31.3% 27.9% 24.5%Asia/PacificNo. of properties 11 11 10 12 11No. of rooms 4,197 4,197 3,813 4,735 4,478Occupancy (3) 63.3% 70.8% 73.5% 72.5% 73.1%ADR (4) $ 232.30 $ 257.54 $ 267.46 $ 238.71 $ 214.63REVPAR (5) $ 147.04 $ 182.32 $ 196.45 $ 173.15 $ 156.87Gross operating margin (6) 31.2% 33.3% 33.8% 29.2% 28.4%EuropeNo. of properties 3 2 2 2 3No. of rooms 390 390 325 325 634Occupancy (3) 78.5% 79.2% 81.4% 78.9% 69.2%ADR (4) $ 689.11 $ 597.68 $ 569.60 $ 515.11 $ 382.99REVPAR (5) $ 541.03 $ 473.22 $ 463.71 $ 406.64 $ 265.04Gross operating margin (6) 42.4% 41.3% 41.7% 39.6% 31.8%(1) Since December 31, <strong>1998</strong>, the Corporation has commenced management of the <strong>Four</strong> <strong>Seasons</strong> Hotel Las Vegas which has 425 rooms.(2) The term “Stabilized <strong>Hotels</strong>” means hotels <strong>and</strong> resorts that were fully open under <strong>Four</strong> <strong>Seasons</strong> management throughout a particular year <strong>and</strong> during thelast quarter of the prior year. Stabilized <strong>Hotels</strong> data is used when information for more than two years is provided.(3) Occupancy percentage is defined as the total number of rooms occupied divided by the total number of rooms available.(4) ADR is defined as average daily room rate per room occupied.(5) REVPAR is defined as average room revenue per available room. REVPAR is a commonly used indicator of market performance for hotels <strong>and</strong> representsthe combination of the average daily room rate <strong>and</strong> the average occupancy rate achieved during the period. REVPAR does not include food <strong>and</strong> beverage orother ancillary revenues generated by a hotel.(6) Gross operating margin represents gross operating profit as a percent of gross operating revenue.29<strong>Four</strong> <strong>Seasons</strong> <strong>Hotels</strong> Inc.