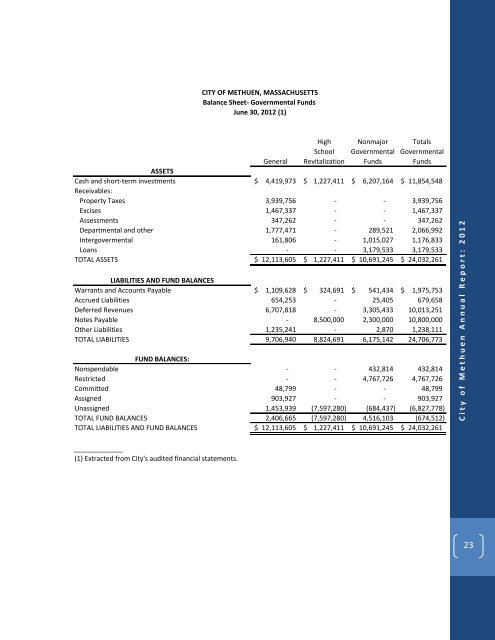
C i t y o f M e t h u e n A n n u a l R e p o r t : 2 0 1 2CITY OF METHUEN, MASSACHUSETTSBalance Sheet- Governmental FundsJune 30, <strong>2012</strong> (1)High Nonmajor TotalsSchool Governmental GovernmentalGeneral Revitalization Funds FundsASSETSCash and short-term investments $ 4,419,973 $ 1,227,411 $ 6,207,164 $ 11,854,548Receivables:Property Taxes 3,939,756 - - 3,939,756Excises 1,467,337 - - 1,467,337Assessments 347,262 - - 347,262Departmental and other 1,777,471 - 289,521 2,066,992Intergovermental 161,806 - 1,015,027 1,176,833Loans - - 3,179,533 3,179,533TOTAL ASSETS $ 12,113,605 $ 1,227,411 $ 10,691,245 $ 24,032,261LIABILITIES AND FUND BALANCESWarrants and Accounts Payable $ 1,109,628 $ 324,691 $ 541,434 $ 1,975,753Accrued Liabilities 654,253 - 25,405 679,658Deferred Revenues 6,707,818 - 3,305,433 10,013,251Notes Payable - 8,500,000 2,300,000 10,800,000Other Liabilities 1,235,241 - 2,870 1,238,111TOTAL LIABILITIES 9,706,940 8,824,691 6,175,142 24,706,773FUND BALANCES:Nonspendable - - 432,814 432,814Restricted - - 4,767,726 4,767,726Committed 48,799 - - 48,799Assigned 903,927 - - 903,927Unassigned 1,453,939 (7,597,280) (684,437) (6,827,778)TOTAL FUND BALANCES 2,406,665 (7,597,280) 4,516,103 (674,512)TOTAL LIABILITIES AND FUND BALANCES $ 12,113,605 $ 1,227,411 $ 10,691,245 $ 24,032,261_____________(1) Extracted from <strong>City</strong>'s audited financial statements.23
C i t y o f M e t h u e n A n n u a l R e p o r t : 2 0 1 2CITY OF METHUEN, MASSACHUSETTSGovernmental FundsStatement <strong>of</strong> Revenues, Expenditures and Changes in Fund BalancesJune 30, <strong>2012</strong> (1)High Nonmajor TotalsSchool Governmental GovernmentalGeneral Revitalization Funds FundsREVENUESProperty taxes $ 64,412,641 $ - $ - $ 64,412,641Excise taxes 4,714,524 - - 4,714,524Departmental 2,090,431 - - 2,090,431Licenses and permits 1,191,807 - - 1,191,807Intergovernmental 60,465,469 3,126,939 13,210,866 76,803,274Charges for services 72,685 - 5,335,396 5,408,081Interest and penalties 407,689 - - 407,689Investment income 10,399 - 765 11,164Fines and forfeitures 236,324 - - 236,324Contributions - - 66,569 66,569Other revenue 199,988 10,651 236,507 447,146Total Revenues $ 133,801,957 $ 3,137,590 $ 18,850,103 $ 155,789,650EXPENDITURESCurrent:General government $ 24,410,780 $ - $ 121,791 $ 24,532,571Public safety 16,375,267 - 1,872,080 18,247,347Education 76,442,580 6,430,597 13,489,595 96,362,772Public works 5,373,099 - 2,426,815 7,799,914Sanitation 2,381,366 - 81,464 2,462,830Health and human services 1,098,069 - 238,873 1,336,942Culture and recreation 1,059,526 - 678,356 1,737,882Debt service:Principal 6,560,000 - - 6,560,000Interest 1,536,297 - - 1,536,297Total Expenditures 135,236,984 6,430,597 18,908,974 160,576,555Excess (deficiency) <strong>of</strong> revenues over expenditures (1,435,027) (3,293,007) (58,871) (4,786,905)24OTHER FINANCING SOURCES (USES)Issuance <strong>of</strong> notes - - - -Transfers in 1,360,523 - 1,360,523Transfers out - - (95,000) (95,000)Total Other Financing Sources (Uses) 1,360,523 - (95,000) 1,265,523Net change in fund balance (74,504) (3,293,007) (153,871) (3,521,382)Fund Balances, at Beginning <strong>of</strong> Year 2,481,169 (4,304,273) 4,669,974 2,846,870Fund Balances, at End <strong>of</strong> Year $ 2,406,665 $ (7,597,280) $ 4,516,103 $ (674,512)____________________(1) Extracted from <strong>City</strong>'s audited financial statements.